


Catastrophe risk modelers delivered a wide range of estimates of insured losses from Hurricane Milton this week—ranging from a low of $17 billion to a high of $50 billion.
Estimates as of Oct. 17 are set forth on the table below. All include private market wind, storm surge, and inland flood insured losses, while only estimates from CoreLogic and Moody’s RMS include National Flood Insurance Program losses.
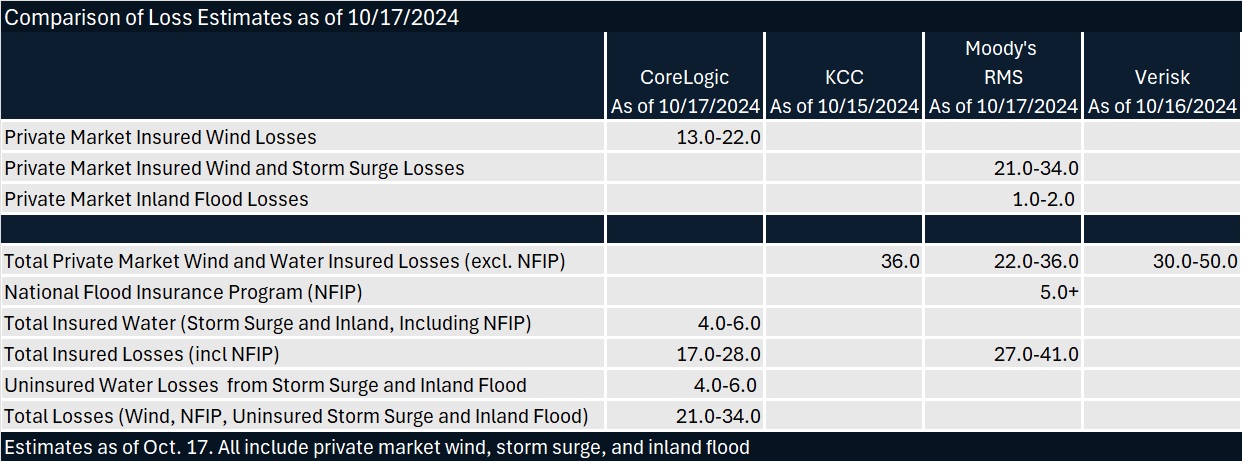
The low of $17 billion is the low end of CoreLogic’s range, which extend to a high-end estimate of $28.0 billion in insured losses, including an undisclosed amount of NFIP losses. CoreLogic’s high estimate is lower than estimates from Karen Clark & Company and Verisk—both of which exclude NFIP. CoreLogic’s high estimate also sits near the low end of the range of estimates announced by Moody’s RMS, which includes an estimate of $5.0 billion for NFIP.
Related articles: KCC Expects Private Insured Losses of $36B From Hurricane Milton; Hurricane Milton Insured Losses in $30B-$50B Range, Says Verisk; Experts Predict Impacts of $20-$25B+ Milton Hit to Insurers, Reinsurers
Among the modelers, only CoreLogic provides an estimate of uninsured flood losses—increasing its total by an additional $4.0 billion-$6.0 billion for this.
In general, the various estimates include provisions for damage to automobiles as well as residential and commercial property and provisions for business interruption. In addition to their treatment of NFIP losses, modelers differ, however, in terms of whether they include provisions for watercraft, post-event loss amplification and non-modeled losses from extended power outages and tornadoes. Only Moody’s RMS said that it considers all of these. KCC and CoreLogic do not include tornado or watercraft losses, and their announcements are silent on whether they have considered demand surge or other elements of post-loss amplification.
(Editor’s Note: A blog item on Moody’s website related to the pandemic catastrophe explains that in addition to economic demand surge—increased repair costs from shortages of labor and materials—other post-loss amplification factors can include repair costs increase resulting from property damage left unattended, political pressure to expand coverage, and “super-cat effects” leading to long-term evacuations.)
Verisk specifically states that loss estimates from the Extreme Event Solutions group do include the impact of one component of post-loss amplification in its estimates—demand surge—but do not include non-modeled losses, including those resulting from tornadoes spawned by Hurricane Milton.
Separately, Verisk provided more demand surge information, delivering some data on the post-Helene and Milton costs of labor and building materials from Verisk’s Property Estimating Solutions team—another Verisk team that does research and reports on pricing data from a variety of sources to guarantee accurate prices for the restoration industry.
The pricing update revealed that:
- The overall price of hourly billable labor is up 4.6 percent in the areas impacted by Hurricanes Helene and Milton from September to Oct. 17.
- In contrast, the average monthly change for hourly billable labor costs prior to the hurricanes was 0.5 percent for the affected areas in the past 12 months.
- In Florida, labor costs increased 2.9 percent from September to Oct. 17, compared to an average monthly change of 0.4 percent for prior 12 months.
- In Florida’s Tallahassee and Panama City areas, labor costs increased more than 6 percent from September to Oct. 17.
- In North Carolina, labor cost jumps over the same period averaged 7.6 percent, with 10 percent jumps seen in the Hickory area.
In addition, Verisk reported that the cost for a basket of goods containing common construction items rose 2.5 percent in the impacted areas compared to a 0.4 percent change at the national level.
The other modelers offered the following observations along with their numerical forecasts:
KCC
An interesting distinction between Milton and most hurricanes was its winds, said KCC. Usually, a hurricane’s strongest winds are on the right side, but Milton generated winds just as strong on the left. In fact, in eastern Florida where Milton exited Oct. 10 as a Category 1, winds were higher on the left side than the right side.
“Both to the north and south of the track, Hurricane Milton brought tropical storm winds to an extensive region including the entire Florida peninsula and extended north along the coastline into Georgia,” KCC said.
CoreLogic
“Flooding, while severe locally, will not contribute as significantly as wind to the insured loss total,” CoreLogic said.
Explaining Milton’s unusual wind activity, Dr. Daniel Betten, Director of Forensic Meteorology at CoreLogic, noted Milton interacted with the jet stream over the southeastern U.S. as it neared landfall, “causing the winds on the northern and northwestern sides of the hurricane—generally known to be weaker—to be atypically strong,”
“To add to the complexity, weather gauges in coastal Florida also measured hurricane force winds over Sarasota south of where Milton made landfall, essentially creating two distinct lanes of damaging, hurricane-force winds,” he added.
Tom Larsen, Associate Vice President Hazard & Risk Management at CoreLogic, said that large insured losses in the Tampa Bay area that had seemed like a possibility “given the large concentration of property [there], including older residential and high-value commercial structures,” hasn’t materialized. Larsen, who is currently on the ground in Florida, reported that CoreLogic is seeing “less than expected wind damage and very little storm surge flood damage, especially in the population centers of the Tampa Bay area.”
CoreLogic reported that the most severe storm surge flooding occurred at Siesta Key, Fla. right at the point of landfall. Flood depths greater than six feet above the ground surface were reported as far south as Ft. Meyers. Precipitation gauges recorded a maximum rainfall depth in the Tampa Bay area. Widespread rainfall depths between 10 and 15 inches were measured with local maximum of approximately 19 inches in a 24-hour period in St. Petersburg.
Moody’s RMS
“We were fortunate to avoid the ‘grey swan’ event that many feared when Milton tracked and made landfall south of the Tampa-St. Petersburg metro area,” said Mohsen Rahnama, Chief Risk Modeling Officer. “Still, the storm’s large swath of damaging winds, subsequent storm surge, and inland flood footprints affected key exposure areas throughout the state, which will undoubtedly make it one of the costliest hurricanes to impact west Florida.”
Raj Vojjala, Managing Director, Modeling and Analytics, Moody’s, pointed out the overlap across areas affected by high winds and surge not just in Milton and Helene, but also in Ian in 2022, when have yet to fully recover.
“Field reconnaissance confirmed numerous instances of improved resilience of structures that had their roofs replaced recently,” he said. On the other hand, areas with older building stock and roofs in parts of Tampa Bay that had not experienced such high winds in recent times will likely drive notable wind claims in Milton, he said.
Jeff Waters, Director-North Atlantic Hurricane Models, Moody’s, noted that confirmed data to date suggests that Milton produced one of the most prolific tornado outbreaks associated with a tropical cyclone in recent history. “Moody’s RMS Event Response used insights from our own in-person reconnaissance and remote sensing data to analyze these tornado tracks and associated wind speeds. This data is incorporated into our wind reconstructions and overall industry loss estimate for Milton,” he said.
Reporting on KCC by Chad Hemenway
 Execs, Risk Experts on Edge: Geopolitical Risks Top ‘Turbulent’ Outlook
  Nearly 26.2M Workers Are Expected to Miss Work on Super Bowl Monday
  Experts Say It’s Difficult to Tie AI to Layoffs
  What Analysts Are Saying About the 2026 P/C Insurance Market