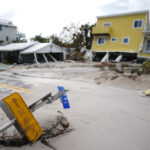
Even before the second megastorm in as many weeks brings devastating floodwaters to the Southeast U.S., it’s already clear that federal flood-risk maps underpinning decisions by millions of American homeowners and businesses are severely out of sync with a new era of climate-intensified disasters.
The best-known guide to flood risk in the U.S. is the Federal Emergency Management Agency’s set of flood maps, which designate high-hazard areas where homeowners with mortgages must buy flood policies. Those maps — which are now widely and incorrectly used to understand flood risk more broadly — are often out of date and don’t focus on the danger of rain-caused flooding, even as rain storms are supercharged by rising temperatures.
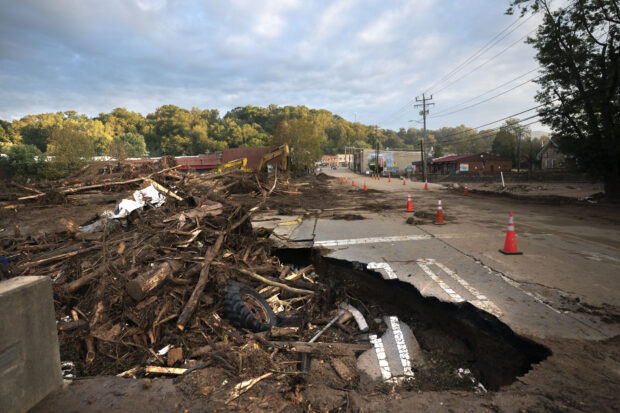
That means many more Americans are exposed to flood risk than the maps—and a look at flood-insurance requirements—might otherwise suggest. A Bloomberg Green analysis shows discrepancies between the FEMA high-risk areas and four locations hit by Hurricane Helene’s floodwaters: Tampa, Fla.; Augusta and Valdosta in Georgia; and Greenville, S.C.
Bloomberg compared FEMA’s publicly available flood maps for the four cities with maximum-flooding estimates from Helene provided by Floodbase, a startup that performs flood analysis and works with providers of parametric flood insurance. The company applies an algorithmic model to satellite images to detect floodwater over geographic areas. Floodbase did not provide data for Asheville, N.C., or other areas in the Blue Ridge Mountains, due to the steep topography there and resulting flash flooding, which its algorithm can underestimate.
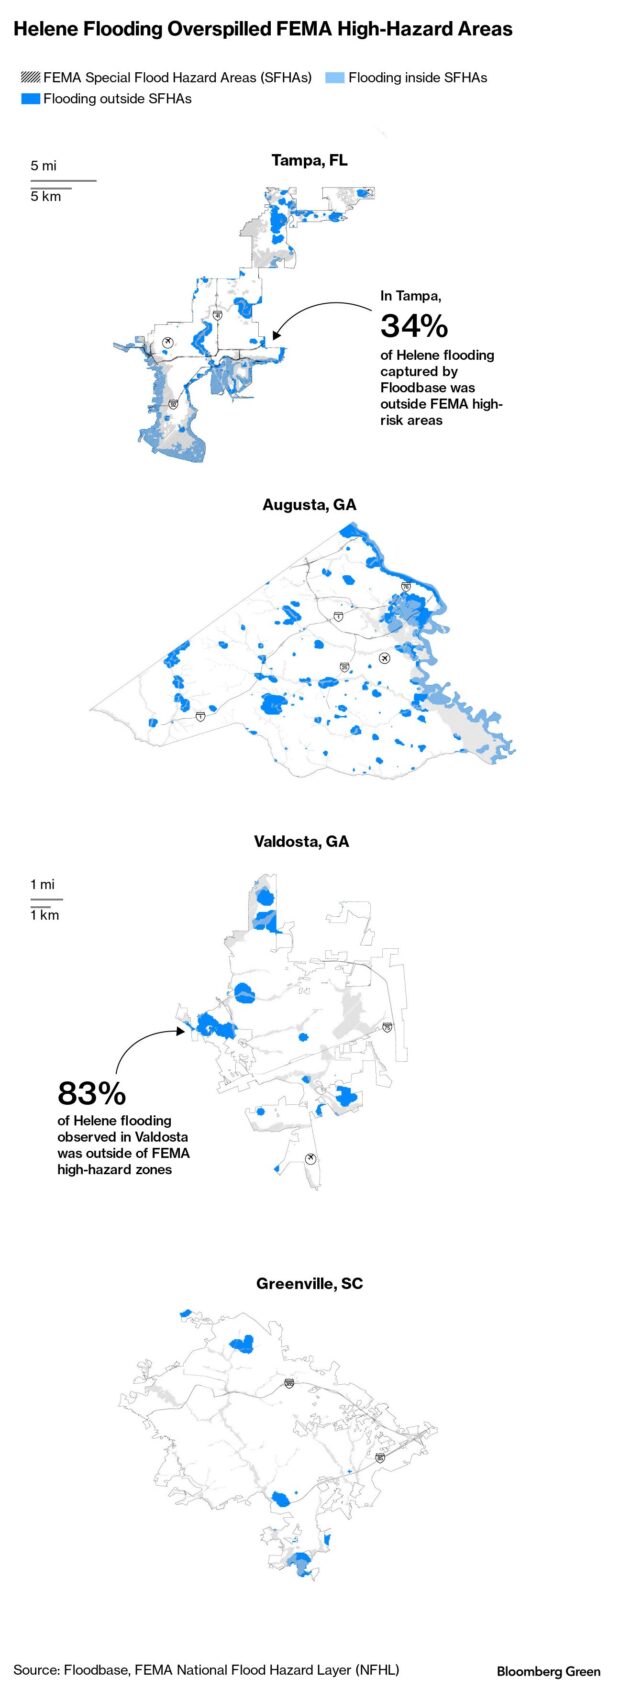
Helene flooding in Tampa, as captured by Floodbase, mostly occurred inside FEMA’s high-risk Special Flood Hazard Areas. About 66 percent of the flooding happened in these zones, while 34 percent of it was observed outside of them.
But in Augusta, less than half (49 percent) of the flooding observed by Floodbase occurred inside the FEMA high-hazard areas. In Valdosta, it was only 17 percent, and in Greenville, 24 percent.
FEMA’s maps indicate which properties have at least a 1 percent chance of flooding each year — or put another way, which properties have a one-in-four chance of flooding over the course of a 30-year mortgage. A spokesperson for FEMA said the maps are designed to focus on river and coastal floods rather than extreme rainfall. The maps show minimum standards for floodplain management and the highest-risk areas requiring flood insurance, the spokesperson added, and “are not predictions of where it will flood.”
Paul Dow, Greenville’s city engineer, said local flooding “occurred in areas previously identified to be at risk.” The city is still carrying out its post-storm assessment, he said, but investigations so far “did not uncover any surprises.” He said the city hasn’t yet determined the number of storm-affected properties outside SFHAs, but within them, several dozen properties were affected, in some cases by tree damage only and not by flooding.
Greenville recently updated its own city floodplain map using climate data through 2019. “Therefore, updated FEMA floodplain maps would not help the city as much as it would help other communities,” Dow said.
Only a small fraction of Americans overall — about 4 percent — hold flood-insurance policies. In coastal areas where hurricanes visit often, like along Florida’s Gulf Coast, the rate is much higher, sometimes topping 50 percent. But inland, it drops off precipitously.
Less than 2 percent of households in Georgia hold policies through the federal National Flood Insurance Program, by far the biggest provider of flood insurance in the country, according to reinsurer Swiss Re AG. In North Carolina and South Carolina the rates are, respectively, about 3 percent and 9 percent.
The U.S. government doesn’t expect homeowners to insure themselves simply out of prudence (although it encourages that). Anyone who buys a home in an area indicated as being high risk is required to purchase flood insurance. The idea is to ensure that vulnerable homeowners are protected.
Yet the maps have received criticism for being incomplete and outdated. Although they are revised periodically, more than 3,000 counties still have flood maps that are more than 15 years old, and some have maps far older than that. Many places in rural America and on federal lands aren’t mapped at all.
“Not only are they often out of date, but they’re not very precise,” Joel Scata, a senior attorney at the Natural Resources Defense Council, said of the maps. “They operate within the 50th percentile of confidence,” meaning they have a high degree of uncertainty.
As criticism of FEMA’s maps has grown, private companies have sprung up offering their own flood-risk maps. While these are more granular and account for climate impacts, they aren’t quality-controlled and often disagree with each other, a Bloomberg Green investigation found.
The agency has a long-running plan to modernize its mapping, and it updated the plan last year. The overhaul will include technology enhancements and integrating climate change impacts into its models. Yet the rollout has been slow. FEMA says ensuring that it’s accurate and scalable will require time and collaboration across every level of government.
“If these flood maps are greatly underestimating the risk — the actual flood risk that people are facing — then we’re not building to the standard we should be building to,” said Scata of the Natural Resources Defense Council. “And we’re not requiring insurance for people who really need it.”
Top photo: Mario Tama/Getty Images


 Lessons From 25 Years Leading Accident & Health at Crum & Forster
  Flood Risk Misconceptions Drive Underinsurance: Chubb
  20,000 AI Users at Travelers Prep for Innovation 2.0; Claims Call Centers Cut
  Berkshire-owned Utility Urges Oregon Appeals Court to Limit Wildfire Damages