


New York City, where drivers lost 101 hours to traffic congestion last year, topped INRIX’s 2023 Global Traffic Scorecard, the transportation data and analytics reported recently.
The firm’s report identified and ranked congestion and commuting trends in nearly 1,000 cities, across 37 countries. New York City was followed by Mexico City and London.
U.S. cities held two spots in the top five and four in the top 10, according to INRIX, which found that Americans lost roughly a full work week, an average of 42 hours, to congestion. That’s up 11 percent from 2022, costing $733 per driver in spite of remote and hybrid work schedules.
The report also found that midday trips in the U.S. have increased 23 percent compared to 2019, with nearly as many trips taken at 12:00 PM as there are at 5:00 PM.
Trip analysis indicates 10:00 AM to 4:00 PM is the new ‘9-to-5,’ the report found.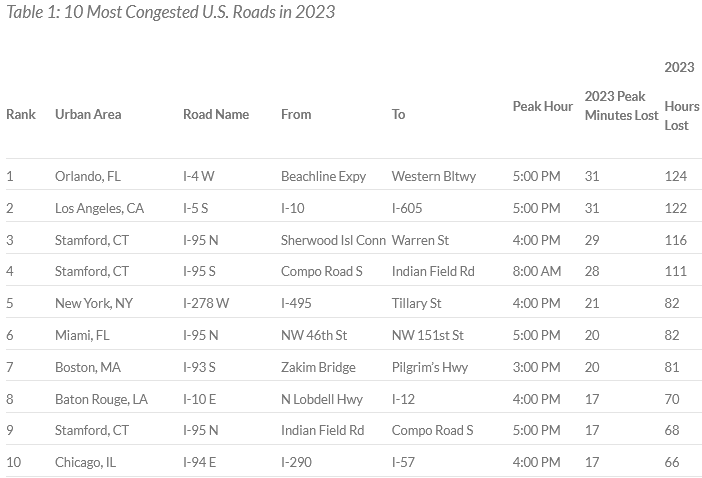
The most congested road in America was Orlando’s I-4 Westbound from Beachline Expressway to Western Beltway, followed LA’s I-5, I-95 in Stamford, and New York’s I-278.
“Traffic congestion is both a bane and a barometer of economic health; it symbolizes bustling activity yet simultaneously hampers it,” said Bob Pishue, transportation analyst at INRIX. “Reflecting on 2023 and early 2024, the surge in traffic congestion in urban areas indicated a revival of economic hubbub post-COVID, but it also led to billions of dollars in lost time for drivers.” Despite signs of recovery, though, some aspects of the pandemic are sticking around. Pishue continued, “Although congestion is returning to pre-COVID levels, we’re seeing interesting changes in congestion patterns due to the lingering effects of the pandemic. The continuation of hybrid and remote work is creating new travel peaks from what we’ve seen previously.”
America’s Gridlock is Worse Than Ever
New York City is followed by Chicago (96 hours) and Los Angeles (89 hours) as the most congested cities in in the United States.
This is New York City’s second year in the top spot, INRIX said, despite a 4 percent reduction in overall congestion.
The typical U.S. driver lost 42 hours to traffic congestion and lost $733 worth of time, up nearly $100 from last year.
In addition to being the most congested urban area, New York City saw a 13 percent increase in downtown trips in 2023 compared to 2022, followed by Atlanta, Philadelphia and Washington D.C (7 percent).
Nine out of 10 of the United States’ largest metros saw a year-over-year increase in downtown trips, the analysis showed. Trip analysis also revealed the traditional 9-to-5 workday has transformed into to a new 10-to-4 schedule. The shift in off-peak commuting and workday hours are likely fueled by the continued prevalence of remote and hybrid work.
A New Midday Rush Hour
Morning hourly commute trips in 2023 were down about 12 percent compared to 2019 and the PM peak (3-6 PM) was down just 9 percent. Hourly traffic during midday increased 23 percent, a trend seen since 2020.
Overall, the data shows that per hour, nearly the same number of trips start during the midday as the evening commute period, typically the most congested period of the day, the report found.
The Most Congested Corridors in the U.S.
Across the United States, traffic delays on the busiest corridors have generally improved since 2022, analysis revealed.
The highest peak delay in 2023 was 2.5 hours less than the peak delay in 2022. Evidence of changing patterns is highlighted by the I-4 in Orlando, Florida, which surged from 10th place in 2022 to the top in 2023. During peak hours, drivers lost 31 minutes on the I-4 westbound, on par with Los Angeles’ notorious I-5 congestion.
In Stamford, Conn., the I-95 corridor demonstrated significant congestion in both directions, earning it the third and fourth spots on the list of most congested U.S. corridors. Northbound travelers on the 30-mile stretch of I-95 lost an average of 29 minutes daily, while those heading southbound faced a slightly lower but still substantial delay of 28 minutes each day.
Congestion Climbs Worldwide
New York, Mexico City, London, Paris and Chicago were the top five most congested urban areas in the Global Congestion Impact Ranking.
Out of the top 100 ranked urban areas, 98 experienced more delay than in 2022, and in 71 areas, that delay grew by more than 10 percent. Just under half, however, have reached their 2019, pre-COVID level of delay.
 Retired NASCAR Driver Greg Biffle Wasn’t Piloting Plane Before Deadly Crash
  What Analysts Are Saying About the 2026 P/C Insurance Market
  Execs, Risk Experts on Edge: Geopolitical Risks Top ‘Turbulent’ Outlook
  Nearly 26.2M Workers Are Expected to Miss Work on Super Bowl Monday