Anyone comparing results of the J.D. Power 2024 U.S. Auto Insurance Study with prior editions, like the one in 2023, will notice that scores dropped by nearly 200 points—to an average of about 646 in 2024 from 822 in 2023.
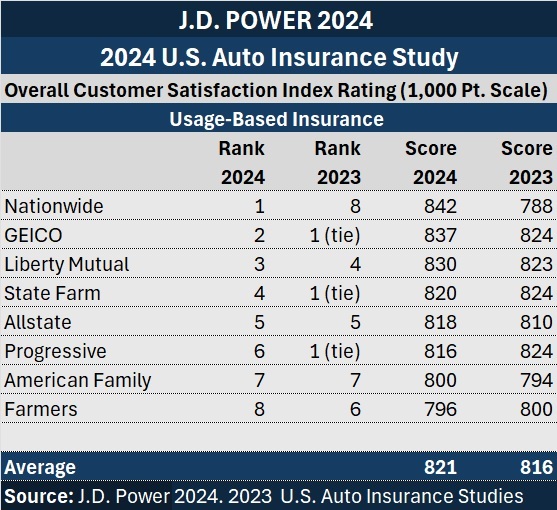
In addition, those overall satisfaction scores, shown region-by-region in a report published last months, are lower than satisfaction scores for the subset of drivers who participate in usage-based insurance programs. UBI scores average out to 821, with Nationwide’s high score of 842 leading the pack of insurers delivering those programs.
Are UBI customers more satisfied this year than other customers?
Probably not.
J.D. Power made several changes to the overall model and calibration for overall scores in 2024, Breanne Armstrong, director of global insurance intelligence at J.D. Power, explained during a webinar last week, “The Evolution of Auto Insurance Customer Satisfaction.” In an email to Carrier Management, she reported that similar changes won’t hit the UBI scores until 2025.
Absent the calibration change for the overall scores, the UBI satisfaction scores would fall slightly behind the overall satisfaction scores in 2024, she said.
Understanding the Overall Score Changes
During the webinar, Armstrong explained that for the overall scores, J.D. Power has worked to simplify the U.S. survey so that respondents can complete a collection of core questions, relating to seven dimensions of customer relationships, more easily.
Importantly, starting in 2024, survey takers are offered six choices to grade auto insurers in responding to questions: poor, just OK, good, great, excellent or perfect.
Previously, J.D. Power used a 10-point scale, and responses tended to lean toward the positive end of the spectrum without much differentiation, Armstrong reported on the webinar. The poor-to-perfect scale proved to be the most reliable, revealing the most discrimination on J.D. Power’s tests of different types of scales. “Even though the six-point scale then gets basically converted to a 10-point scale, the scores are going to look lower” starting in 2024, she said. “Now, in order to select ‘perfect,’ it really has to be a truly exceptional experience—and we don’t have nearly as many respondents selecting that top bucket,” she explained. As a result, index scores look lower.
The model for the satisfaction scores has changed in another way, she said, at one point noting that a move to gauge insurer performance on several customer experience dimensions rather than insurance-specific transactions allows the insurance industry satisfaction studies to be compared to other industries. Dimensions like “level of trust” and “ease of doing business” are common aspects of experience that all surveys now delve into, she said, showing that the auto insurance overall score of 646 now ranks well below industries like mortgage origination and direct banking, which come in over 700.
For auto insurance, the prior model centered on five transactional factors:
- Non-claims interaction
- Price
- Policy offerings
- Billing process and policy information
- Claims
Departing from the factor-attribute model in 2024, the new holistic approach focuses on these seven dimensions of customer experience:
- Level of trust
- Price for coverage
- People
- Ease of doing business
- Product/coverage offerings
- Problem resolution
- Digital channels
Telematics: A Different Race. A Different Leader
Unlike the overall customer satisfaction scores, neither the components of the UBI satisfaction scores nor the calibration scale for calculating them have changed in 2024. According to Armstrong, UBI scores are based on these factors:
- Initial program setup/onboarding (for drivers that signed up for UBI within the past year)
- Ease of participating in the program
- Usefulness of the information received
- Functionality of the app/website
- Discounts received for participation
In an email to Carrier Management, she noted that absent the change in the scale used for the overall scores—from the prior 10-point scale to the new poor-to-perfect 6-point scale— the UBI satisfaction scores would fall slightly behind the overall satisfaction scores in 2024.
“When we segment auto insurance customers by whether they are currently participating in a UBI program or not, we see some big differences in how customers rate their overall experience with their auto insurer,” she added, noting that UBI participants are included in the full study in addition to evaluating their specific experience with UBI.
“Price for coverage, one of the [overall] study dimensions, is over 50 points higher for those currently participating in a UBI program vs. those who aren’t participating,” she wrote. “Interestingly, when we focus in on just the UBI portion of experience, the UBI attribute “discounts received for participation” is nearly flat year-over-year, while the attributes “ease of participating,” “functionality of the app/website” and “usefulness of the information received” are up slightly.
“So, despite the lack of improvement in the perception of the discounts UBI participants are getting, they are still rating the ‘price for coverage’ for their auto insurer significantly higher than those not enrolled in a UBI program,” she wrote. “It’s possible that they see additional value in UBI outside of just the benefit of getting a lower price on auto insurance.”
Armstrong also noted that the “digital channels” dimension of overall scores is higher for UBI participants, perhaps reflecting the fact that they are typically more engaged digitally. “Additional exposure to the digital experience with their carrier may be driving that, or it is possible that those who are more digitally savvy are more apt to sign up for UBI,” she wrote.
A key takeaway, she concluded, “is that UBI participation had the potential to improve the overall perception of the carrier and the customer experience.”
Armstrong noted that the calibration scale used for UBI satisfaction scores, like the overall satisfaction scores, will change from a 10-point to a 6-point scale next year in 2025.
During the webinar, Armstrong also described some study enhancements on tap for 2025 with survey modules, including an expanded UBI section that will delve into changes in driving behavior for UBI customers and whether or not some customers get pricing penalties based on driving behavior, among other things.
Other areas that J.D. Power will look into in 2025 include customer reasons for bundling home and auto, and customer awareness and usage of value-add non-insurance services (coupons, memberships, mitigation services, etc.)
Nationwide Tops UBI Ranking
In 2023, GEICO, Progressive and State Farm all tied for a first-place UBI satisfaction ranking. For the latest 2024 study, however, it was Nationwide that topped the list.
In fact, Nationwide leapt from the worst UBI satisfaction rating in 2023 to the best in 2024.
Related article: Nationwide Insurance: Using a Decade of Learnings to Create Next-Generation Telematics Solutions
Nationwide’s 842 UBI score beat GEICO by 5 points, and Progressive, State Farm and Allstate by 22 points or more.
Breaking last year’s tie, GEICO’s took second place on UBI satisfaction in 2024 (score 837), with State Farm moving to fourth place (820), and Progressive to sixth place (816).
What Factors Impacted Overall 2024 Scores
During the webinar, Armstrong drilled down on regional score variations for each of the dimensions included in the 2024 survey. She also offered insights on which of the legacy attributes that fed the prior model have the biggest impact on dimensions in the new model. For example, for the trust dimension, price—”unsurprisingly”—is impactful. But also impacting trust are things like courtesy extended to customers when they are assisted online or by agents, and also knowledge of insurance agents, she said.
For each dimension, Armstrong also spoke about the key performance indicators having the most impact on scores. As an example, she noted that for customers that had call center experience, trust plummets if an insurer’s customer service rep doesn’t have the customer’s information ready.
Another performance misstep likely to push down customer trust was a failure to provide an accurate time frame for the resolution of a claim. Leaving customers in the dark about what their policies cover or why the prices of their policies went up also drive down trust scores, she said.
When Armstrong detailed KPIs impacting other dimensions, some of the same ones popped up. Ensuring that a CSR has customer information readily available, for example, has an impact on the scores for ease of doing business and product/coverage dimensions.
According to Armstrong, ensuring that customers understand what their policies cover is the top KPI and impacts all dimensions analyzed by J.D. Power.
At one point during the webinar, Armstrong displayed a map showing trust scores by region and corresponding levels of rate changes. Florida, the region with the lowest trust score, also had the most respondents reporting insurer-initiated price increases.
Managing expectations is key, she suggested, going on to show trust score variances for different levels of customer expectation. Customers who expected and understood why they were getting rate hikes scored their levels of trust at 736—on par with customers who saw their premiums actually decline.
***
Interested in knowing which U.S. auto insurers customers judged to be leaders and laggards?
Read the article, “GEICO Tops Progressive With Higher J.D. Power Scores,” for information on how individual insurers scored on overall auto insurance satisfaction.
 How Americans Are Using AI at Work: Gallup Poll
  20,000 AI Users at Travelers Prep for Innovation 2.0; Claims Call Centers Cut
  What Analysts Are Saying About the 2026 P/C Insurance Market