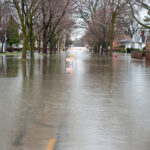
Bad weather and auto insurance struggles took their toll on U.S. property/casualty insurers through the 2016 first half, leaving the industry with its first H1 net underwriting loss in more than three years.
The sector booked a $1.5 billion net underwriting loss for the 2016 first half, a reality that has not hit the industry in over three years, according to a new report from the Property Casualty Insurers Association of America and ISO, a Verisk Analytics business.
After taxes, U.S. P/C insurers saw their net income for the first six months of 2016 drop to $21.7 billion compared to $31 billion over the same period in 2015.
 While the U.S. P/C combined ratio for H1 landed below 100, it did so just barely. The combined ratio came in at 99.8 for the 2016 first half, a deterioration over the 97.6 combined ratio for the same period in 2015.
“Catastrophe losses remained higher than in previous years,” ISO Solutions President Beth Fitzgerald said in prepared remarks. “Texas was hit by a hailstorm that has been described as the costliest in the state’s history, and several states in the central United States experienced severe thunderstorms.”
Along those lines, direct insured property losses from U.S. catastrophes came in at $13.5 billion for H1 2016, $10 billion higher than the same period in 2015. That’s also a spike over the $11.6 billion average for direct catastrophe losses in the first six months of the year over the past decade, the ISO/PCI report noted.
Auto Insurance Results Disappoint/ Q2 Troubles
What is also ominous, according to the ISO/PCI report, is that auto insurance results are still lagging. For the 2016 first half, the personal lines insurance combined ratio worsened to 103.1 from 100 in H1 2015. Commercial lines insurers also saw their combined ratios grow, to 96 compared to 94.6 a year ago.
“The underperformance of auto insurance continues to drag down industry underwriting results,” Fitzgerald said. “Industry statistics we’re monitoring indicate that direct personal and commercial auto liability losses each spiked over 11 percent from the first half of 2015, significantly outstripping premium growth.”
For the 2016 second quarter, U.S. P/C insurers’ net income after taxes reached $8.3 billion, but that’s down from nearly $13 billion in the 2015 second quarter. The combined ratio worsened to 102.1 in Q2 from 99.4 over the same year-ago period.
Net written premiums grew nearly 3 percent in Q2, but that’s a drop from 4.5 percent in the 2015 second quarter.
Other U.S. P/C industry results from the 2016 first half:
- Net investment income declined to $22.1 billion versus $23.4 billion in H1 2015. Insurers’ realized capital gains were $4.4 billion, down from $8.2 billion a year ago. This resulted in net investment gains of $26.5 billion, down $5.1 billion from H1 2015.
- The industry surplus hit $680.6 billion as of June 30, 2016, an all-time high.
- The 30.2 percent dip in net income after taxes pushed insurers’ annualized rate of return on average surplus to 6.4 percent. That’s 2.8 points lower than the 9.2 percent annualized rate of return for the 2015 first half and 2.6 points under the 30-year average for the H1 rate of return for 1986-2015.
- H1 net written premiums surpassed $264.65 billion, up from $256.8 billion in H1 2015. Net earned premiums hit $257 billion versus $247.66 billion during the same six-month period in 2015.
Sources: ISO/Verisk and PCI


 Winter Storm Fern to Cost $4B to $6.7B in Insured Losses: KCC, Verisk
  Flood Risk Misconceptions Drive Underinsurance: Chubb
  Preparing for an AI Native Future
  Berkshire-owned Utility Urges Oregon Appeals Court to Limit Wildfire Damages


