While there are signs that general liability insurance prices started falling off for the largest accounts late last year, strong pricing over the past few years has fueled growth for casualty writers, an industry researcher said last week.
David Bradford, president of the Research & Editorial division of Advisen, presented information on pricing trends and insurance market leaders during Advisen’s Casualty Insights conference in New York in late March.
Beginning his talk with a broad view of overall premium movements based on data from the National Association of Insurance Commissioners, Bradford noted that general liability premiums jumped 7.9 percent between 2012 and 2013—the last full year for which the data if available. Seeking to explain what fueled that growth, Bradford used the ADVx graphs to demonstrate that an improving economy alone was not the driver. “We’re dealing with a very healthy market in terms of [pricing] growth at this point and the results have not been too bad either,” he said.
“We have had a general upward trend on rate over the last few years. Not enormously strong. It would be hard to classify this as a hard market but definitely an upward trend,” he said.
 The ADVx graphs revealed that umbrella/excess and product liability showed the biggest pricing gains. Breaking down the umbrella/excess analysis into layers, Bradford showed that the lowest layers experienced the strongest pricing growth with average premiums rising nearly 50 percent for layers above $1 million but less than $10 million between 2011 and 2014. In contrast, prices fell more than 10 percent for layers above $50 million, according to the ADVx graph.
Like the overall umbrella/excess pricing index, the large market general liability index saw some good lift (from the insurance industry perspective) in recent years. But Bradford noted a troubling downward shift in GL pricing for the last two months of 2014.
“The headwinds of overcapacity” may be beginning to have their effects on the marketplace, he suggested, displaying a graph plotting the ADVx GL-Large Market Index on one curve and industry surplus as a percentage of GDP on the other for the time period from 2009 to 2014.
Up until late 2014, the comparison revealed “an economic conundrum” of sorts, Bradford said, noting both curves moved generally upward over the five-year time frame.
“Surplus is at an all-time high but that surprisingly has not forced down prices. In a normal, supply-and-demand scenario you would expect that to happen. But it’s not. Prices continue to go up.
“Capacity goes up and prices continue to rise,” Bradford said, observing the overall trends.
Like many analysts, Bradford offered the low interest rate environment as a key factor that has thrown the usual supply-demand dynamics out of whack, noting that the 10-year Treasury was roughly 1.8 percent in January 2015. “We’ve got to make it up in the loss ratio,” he said. “It’s put some discipline in the market.”
“I have been watching the market for over 30 years and I have never seen the kind of discipline we have at this stage in the market,” he reported.
But Bradford sees signs of a change coming soon, offering the evidence of a downward drift in the ADVx GL-Large Market index in November and December 2014 as a sign of things to come.
“The low interest rate environment is going to continue to keep pressure on the underwriting results. There’s going to be a lot of pressure to continue to keep those rates up. But at the same time, overcapacity is just going to eventually take its toll.”
“The market is very overcapitalized and very competitive. Despite the competition, rates have been going up” in recent years, “but I think we could see rates stabilizing and trending down in 2015,” he predicted.
U.S. Liability Insurance Market Competitors
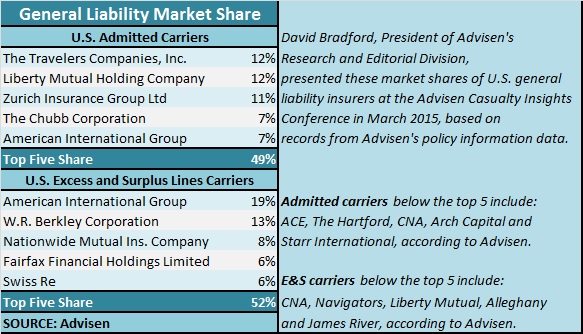
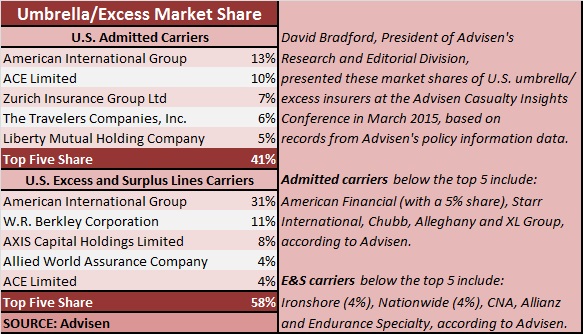
During his presentation, Bradford offered a look at the largest competitors in the liability insurance market, using Advisen policy data to rank U.S. admitted market separately from excess-and-surplus lines writers for general liability and for the umbrella/excess market.
He observed that the admitted umbrella market is little more fragmented than the primary GL market, with the top five umbrella players taking a 41 percent share; in the GL market, the top five players account for nearly 50 percent.
Offering some analysis of the E&S market, Bradford noted that American International Group stands out as the dominant player for both GL and umbrella business. With AIG taking 31 percent of the E&S umbrella market, W.R. Berkley and AXIS Capital round out the top three, controlling half of that market between them, according to Advisen data.
Bradford provided further insight into carrier appetites for risk managers in attendance displaying a comparison of changes in the average attachment points of policies written by nine top carriers in recent years. Focusing on policies for manufacturing risks, The Hartford displayed the greatest consistency—and lowest attachment points of the group—with an average attachments “rock steady year in and year out,” according to Bradford—at about $1 million for every year in the 2007-2014 period of the graph.
For other carriers, Bradford revealed movements up and down, but with more typically in the upward direction over the seven-year span.
While Hartford was consistently at the bottom with the lowest attachment points, Allianz showed up at or near the top with attachments between $15 and $30 million over the same period.
(Editor’s Note: Other than Hartford, seven of eight remaining carriers moved attachments down in 2014 compared to 2013—the exception being Alleghany, according to the graphs Bradford presented).


 Beazley Agrees to Zurich’s Sweetened £8 Billion Takeover Bid
  Modern Underwriting Technology: Decisive Steps to Successful Implementation
  Lessons From 25 Years Leading Accident & Health at Crum & Forster
  Retired NASCAR Driver Greg Biffle Wasn’t Piloting Plane Before Deadly Crash


