Swiss Re Institute (SRI) made a significant contribution to the literature on social inflation and its impacts on insurers, reinsurers and their customers with the calculation of a new measure—a social inflation index. (Related article: U.S. Nuclear Verdicts Break Records; Social Inflation Up to 7% in 2023: Swiss Re)
How did they do it?
Below, we set forth some of the calculations details from Swiss Re Institute’s sigma report, titled “Litigation costs drive claims inflation: indexing liability loss trends.”
To calculate the index, SRI analysts started with a basic definition: Social inflation is the difference between claims severity growth and claims inflation driven solely by economic factors, where claims severity is defined as the average size of claims.
Social inflation = claims severity growth – economic inflation
SRI developed a measure of claims severity growth by removing the impacts of growing economic activity (exposure growth) and changes in claims frequency from overall claims growth.
Claims severity = claims growth – exposure growth – frequency changes
“More economic activity implies more companies, more workers, more vehicles etc., leading to more accidents or other harmful actions,” the report says, explaining the need to subtract a measure of exposure growth—real gross domestic product (GDP) growth—from claims growth.
Claims frequency is the number of claims relative to the number of policies, which will affect claims growth regardless of claims severity. A footnote in the report notes reveals that there has actually been a long-term declining trend in claims frequency in general liability and medical malpractice, while claims frequency in commercial auto has been trending up since 2021 (according to Verisk data reviewed by SRI).
With the claims severity growth component of the social inflation calculation squared away, SRI went on to tackle the economic inflation part—the measure to be subtracted from claims severity growth to isolate social inflation. For that, SRI analysts used a weighted average of three Consumer Price Index measures from the U.S. Bureau of Labor Statistics—healthcare, wage and core CPI inflation. These have the highest correlation to liability claims severity, the SRI report states. (Core inflation excludes food and energy prices, which are not only more volatile but are also not typically drivers of tort liability claims, according to a footnote.)
According to a Swiss Re representative, the weights are the same for all years—roughly a third each for healthcare, wage and core CPI inflation, with core CPI receiving a slightly higher weight (37 percent) than the other two. No other adjustments were made to the BLS figures.
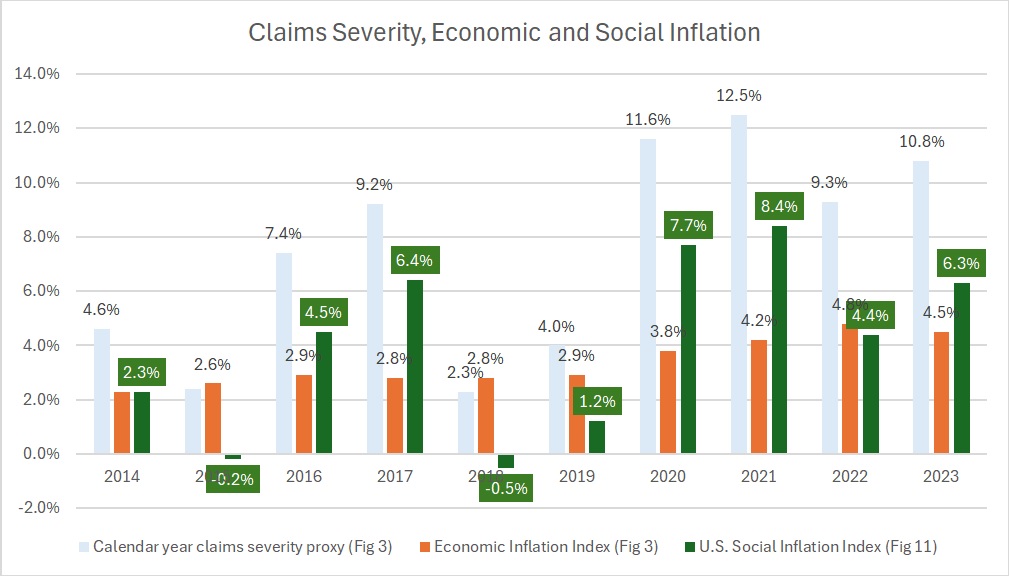
Using some of the calendar year claims severity and economic inflation index figures available from an online presentation of the SRI report, Carrier Management assembled the chart below for the last decade.

The chart illustrates the basic calculation: social inflation equals claims severity growth minus economic inflation. The accompanying chart, however, does not show the final social inflation index figures ultimately published in the Swiss Re report, which include some further averaging adjustments.
First, the green bars on the chart depict a calendar-year social inflation index, using calendar year claims severity (light blue bars) as a starting point. The SRI report notes, however, that claims trends differ based on calendar or accident year data due to reserving. SRI chose the average of accident year and calendar year social inflation indexes for the final published report.
In addition, a Swiss Re representative explained that an earlier version of the index used two-year averages for the SRI calculations, which were updated to three-year averages for the final published report. Some charts in the SRI report (Figures 3 and 11), captured above by CM, show two-year averages.
“All variables are analyzed as three-year moving averages to reduce random noise from accounting data and to reflect the average lags between economic data and average claims settlement,” the report states.
“In the U.S., three-year average growth in claims severity has exceeded economic inflation metrics since 2014,” the report states. “This implies that other, non-economic factors have played a large role in driving liability claims severity. We consider this residual to be social inflation,” the SRI report says, estimating the residual to be around 7 percent by 2023.
Related article: U.S. Nuclear Verdicts Break Records; Social Inflation Up to 7% in 2023: Swiss Re
The continuing non-zero values since 2014 give an “indication of the increasing impact that social inflation is having on claims costs,” the report states.


 Modern Underwriting Technology: Decisive Steps to Successful Implementation
  Beazley Agrees to Zurich’s Sweetened £8 Billion Takeover Bid
  Insurance Groundhogs Warming Up to Market Changes
  AIG, Chubb Can’t Use ‘Bump-Up’ Provision in D&O Policy to Avoid Coverage

