A hard market, resilient domestic macroeconomic conditions and strong underwriting results have elevated specialty commercial carriers to the top of S&P Global Market Intelligence’s annual U.S. P/C Insurance Performance Rankings in each of the last two years, but recent developments could portend a different outcome in future iterations.
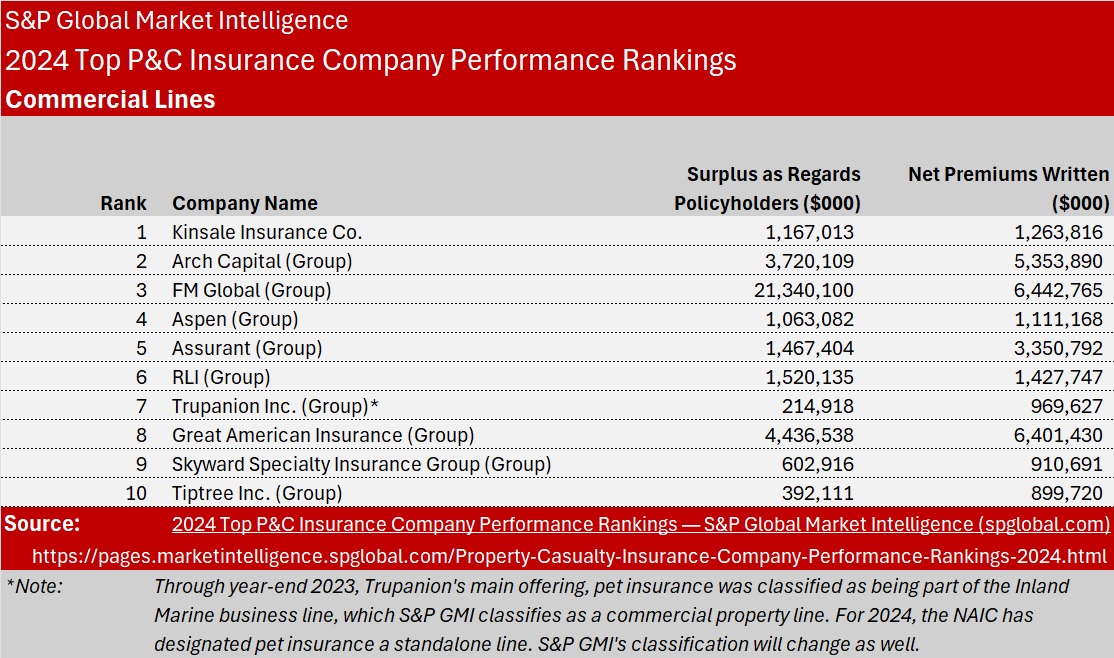
Pure-play U.S. excess and surplus lines carrier Kinsale Capital Group Inc. placed as the top performing P/C entity among the 100-largest writers based on an S&P Global Market Intelligence analysis published July 9. It marked the second straight year that the Richmond, Va.-based company claimed the top spot as it scored particularly highly on the basis of growth in premiums, assets and policyholders’ surplus. (The 100-largest writers were gathered based on 2023 net premiums written.)
The U.S. P/C operations of Arch Capital Group Inc. placed second, followed by FM Global.
Related article: How to Outperform: Don’t Outsource Underwriting; Manage Cycles
Arch Capital’s relative performance was strongest in returns on both assets and average capital and surplus. Its return on average surplus of 38.4 percent placed second highest among the 100-largest P/C entities. (Assurant was the top performer based on return on average surplus.)
FM Global, meanwhile, enjoyed what the company described as one of its most successful years in a history that dates back to 1835, highlighted by a combined ratio of 69.
While many commercial lines writers have benefited from favorable underlying business trends emerging from the COVID-19 pandemic, cyclical pricing trends and the effects of social inflation on the development of reserves for prior accident years could weigh on underwriting performance in 2024 and beyond. At the same time, carriers that emphasize the private passenger auto business appear poised to ascend. Private auto insurers opened 2024 by demonstrating the combination of the most rapid premium growth in more than two decades and a slowdown in the pace of loss-cost inflation from its recent peak.
How Performance Rankings Are Calculated
The performance rankings are determined using 13 financial metrics from 2023 statutory filings grouped into six buckets: rates of return, underwriting profitability, balance sheet expansion, investment performance, prior-accident-year reserve development and premium growth. S&P Global Market Intelligence assigns the buckets distinct weightings to calculate performance scores for each of the 100-largest U.S. P/C groups and standalone P/C entities based on 2023 net premiums written, with a particular emphasis on overall returns and underwriting profitability.
The category that incorporates rates of return on assets and capital and surplus factors most heavily in the rankings with a weighting of 35 percent. Underwriting profitability, which is based on the loss and LAE ratio as well as the operating ratio, carries a weighting of 30 percent.
To determine the performance scores of the individual P/C groups, S&P Global Market Intelligence calculated the mean results for each of the 13 performance metrics, then determined each company’s deviation from those means. S&P Global Market Intelligence then added the 13 weighted deviations together to calculate a final score, with rankings from highest to lowest for the 100 companies.
The rankings and the underlying data are based on annual statutory statements filed with the NAIC. They exclude entities domiciled outside of the United States as well as entities deemed to be focused on the accident and health, private mortgage insurance or bond insurance businesses.
S&P Global Market Intelligence publishes the P/C performance rankings annually in July.
Top Performers
Strong top-line growth, a diverse product mix and a presence in profitable business lines served as common themes among the top performers in 2023. Carriers with a significant presence in catastrophe-exposed residential property insurance business, particularly those with limited geographic diversity, faced an uphill battle after a difficult year for severe convective storm activity in some areas.
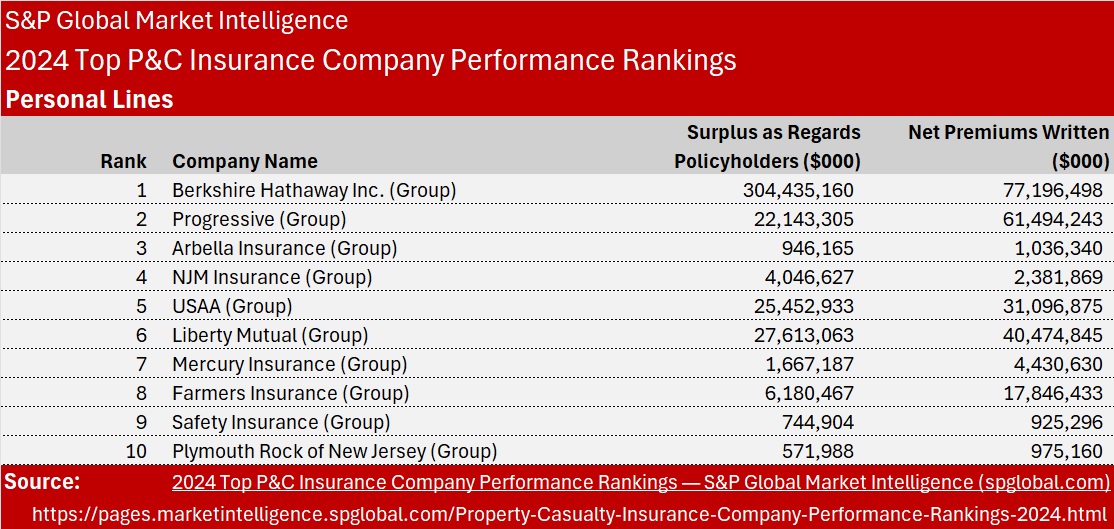
Personal lines-focused entities were scarce among the top 50 P/C insurers in 2023. Only Progressive Corp. and Berkshire Hathaway Inc., parent of No. 3 U.S. private auto insurer GEICO, made the list. Both companies generated combined ratios well below 100 in their private auto businesses during a calendar year in which the overall industry result stood at 104.9.
Many of the largest U.S. private auto writers maintain a significant presence in the homeowners market, which served to compound their difficulties relative to our metrics. The P/C industry’s homeowners combined ratio spiked to 110.9 in 2023, the highest result in 12 years.
In 2024, we project a return to underwriting profitability for the private auto business, which should boost the overall prospects for personal lines-focused carriers from a relative performance perspective. While the combined ratio for the homeowners business is likely to decline from 2023’s elevated result, factors such as the frequency, severity and nature of claims emerging from the North Atlantic hurricane season will have much to say about the extent of the improvement. The 12-month duration of most homeowners policies relative to the six-month terms that have become commonplace in the private auto business means that sharply higher premiums will not earn into carriers’ books as quickly, suggesting that the timeline for better results will extend over a longer period.
Personal lines-focused carriers have fared well in our performance rankings during better times for that business. Applying our performance ranking methodology to the 100-largest P/C insurers in 2019, subject to the same set of criteria used in our 2023 rankings, for example, we find a much more substantial representation of personal lines-focused carriers among the top 50 performers. In 2019, the industry’s combined ratios for the private auto and homeowners lines were both below 99—the most recent calendar year in which each of the two businesses generated results of less than 100. There would have been 17 personal lines-focused carriers among the top 50 performers, including three of the top 10.
The personal lines direct incurred loss ratio fell by more than 11 percentage points in the first quarter of 2024 from a historically elevated result in the year-earlier period. Six of the top seven personal lines writers showed double-digit percentage-point declines.
In addition to some much-needed tailwinds benefiting personal lines carriers, headwinds have begun to emerge in certain parts of the commercial lines. Concerns about the adequacy of loss reserves for the 2015 through 2019 accident years in certain casualty lines were realized late in 2023 as several carriers reported unfavorable development for all or portions of that stretch, citing the effects of social inflation on claims severity. Commercial lines premium growth has continued to retreat from its 2021 peak and, in a number of lines, depends on the ongoing resilience of the U.S. economy.
We suspect that the net result on the U.S. P/C Insurance Performance Rankings will be a more balanced mix of top-performing carriers in 2024, though not necessarily quite to the extent we saw in 2019.
 Berkshire-owned Utility Urges Oregon Appeals Court to Limit Wildfire Damages
  Experts Say It’s Difficult to Tie AI to Layoffs
  RLI Inks 30th Straight Full-Year Underwriting Profit
  What Analysts Are Saying About the 2026 P/C Insurance Market