According to an analysis of loss reserves published in mid-March by Assured Research, 2023 marked the 18th straight year that the U.S. P/C industry’s loss reserves developed favorably—by about $2.3 billion. That’s the good news.
Executive Summary
Predictions that the property/casualty insurance industry is in the midst of repeating the type of loss reserving cycle that accompanied the hard market of the beginning year of this century may be overblown, according to Assured Research’s William Wilt.Even though Assured Research now estimates that the overall redundancy of U.S. P/C carried reserves is about half what it was in each of the past three years, he believes that the nearly $8 billion added to the two most problematic lines has likely filled the financial hole the industry had dug from accident years 2016-2019. And reserve redundancies from workers compensation continue, he writes.
The more concerning news is that the favorable development was only about one-third of the average of the past five years. Moreover, most liability lines of business developed adversely. We can thank workers compensation and a collection of short-tailed property lines—including auto physical damage—for keeping the industry’s long string of favorable development intact.
How worried should industry professionals be?
Our message, captured in the title of our report, is to “keep calm and carry on.” This year, after the industry added nearly $8 billion of loss reserves to the two most problematic lines—other liability occurrence and commercial auto liability—we think much (but not all) of the financial hole the industry had dug from accident years 2016-2019 has now been filled. Meanwhile, the wellspring of reserve redundancies from workers compensation seems far from dry. But tempering that good news is what we perceive to be red-hot loss ratios in commercial auto liability where we forecast loss ratios largely unchanged from the soft cycle (and that after a decade of material rate increases and underwriting actions).
Our Reserving Scorecard
We estimate the industry’s carried reserves on accident years (AYs) 2014-2023 are redundant by about $11.7 billion, or 1.4 percent of carried reserves (for loss and defense and cost containment). That’s about one-half the redundancies we’ve derived each of the past three years.
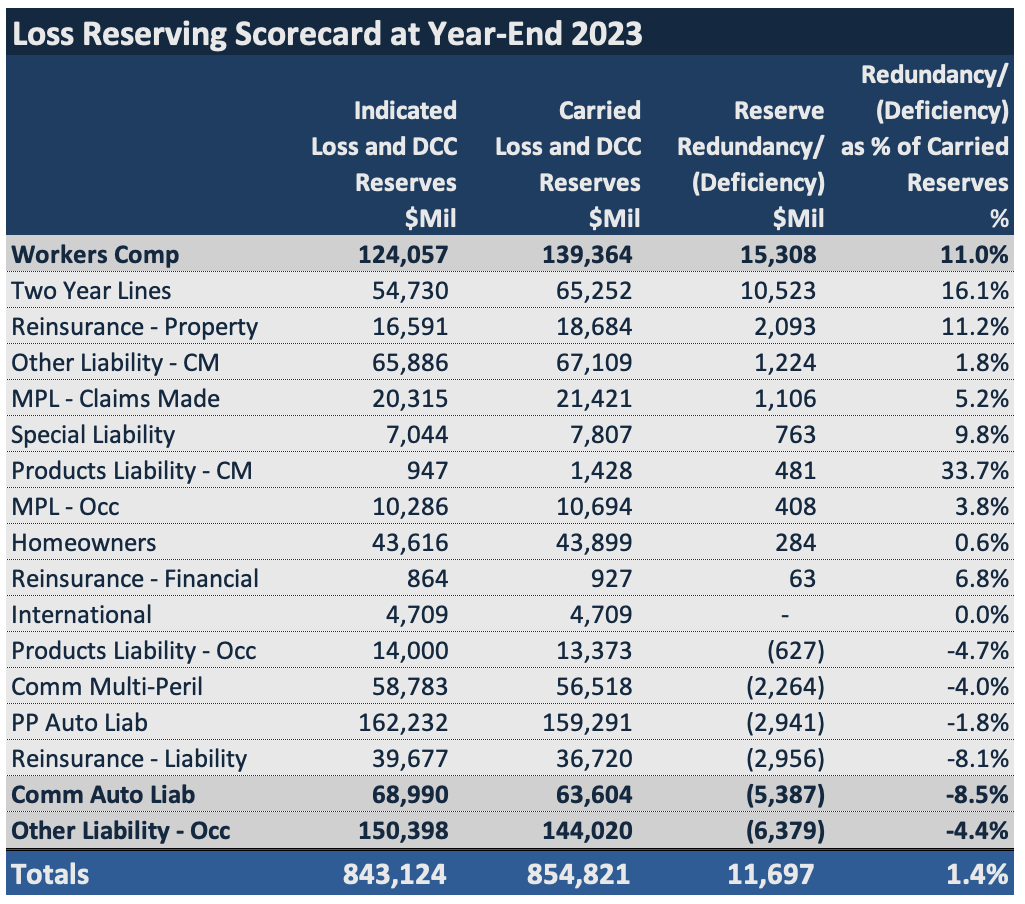
The nearby chart provides the details with positive numbers indicating a reserve redundancy and negative a reserve deficiency. We’ll note that our work doesn’t include analysis of years or liabilities prior to 2014, and we’re not attempting to account for any of the mass tort actions currently in various stages of legal development (oftentimes with bankrupted corporate entities). Last, the boldface type indicates lines with additional exhibits—dashboards—and commentary in this article.
More Big Picture Observations
Our choice of title—Keep Calm and Carry On—isn’t meant to convey a lack of concern over industry reserving trends or the ongoing challenges presented by severity (economic and social inflation) or frequency trends which seem to have not yet reached a post-pandemic stasis. Instead, we’re reacting to concerns, expressed by some, that the industry could revisit the depths of the 9/11-era reserving cycle. We don’t see that happening.
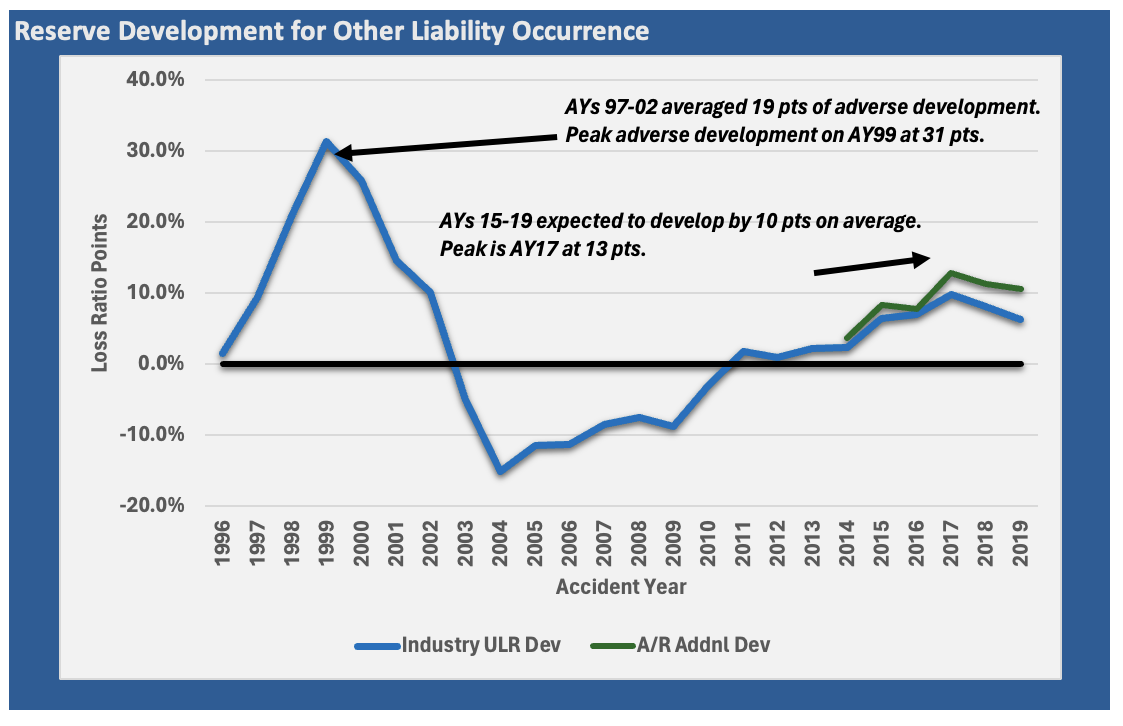
The chart above puts the two reserving cycles in perspective. Other Liability Occurrence (OLO) is the locus of adverse development and industry attention—and deservedly so. But in the nearby graph we can see the material difference in the level of adverse development then, and now. The blue line in the chart represents the difference between the industry’s final (i.e., at 10 years of development) estimate of the ultimate loss ratio (ULR) for each accident year from the initial estimates. The green line over years 2014-2019 represents the additional adverse development we expect to materialize (about 3-4 loss ratio points on AYs 2017-2019).
The Good News: Workers Compensation
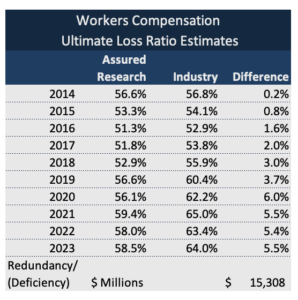
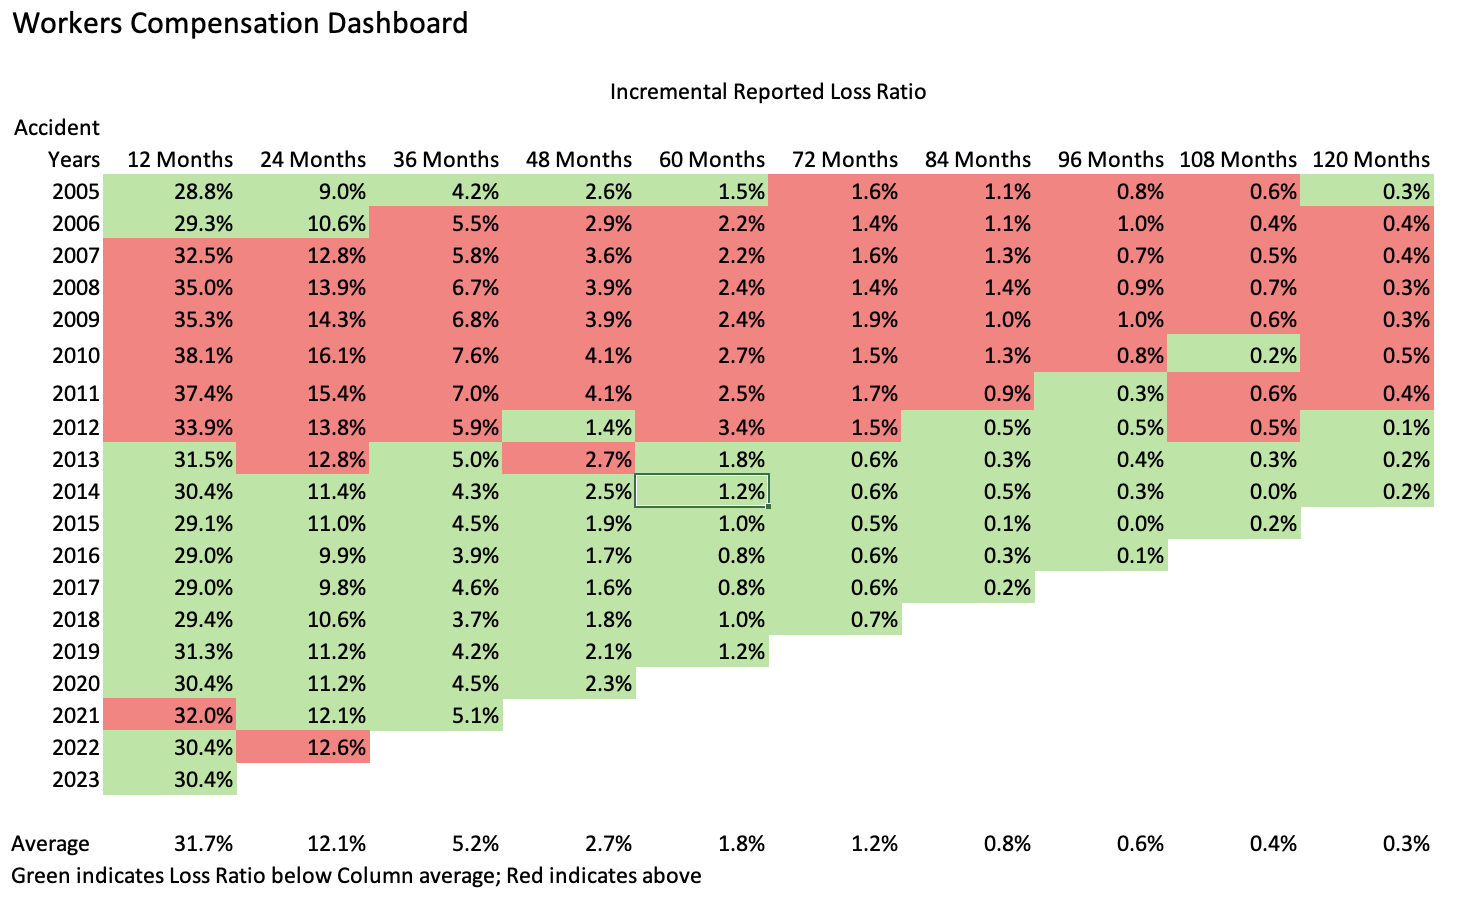
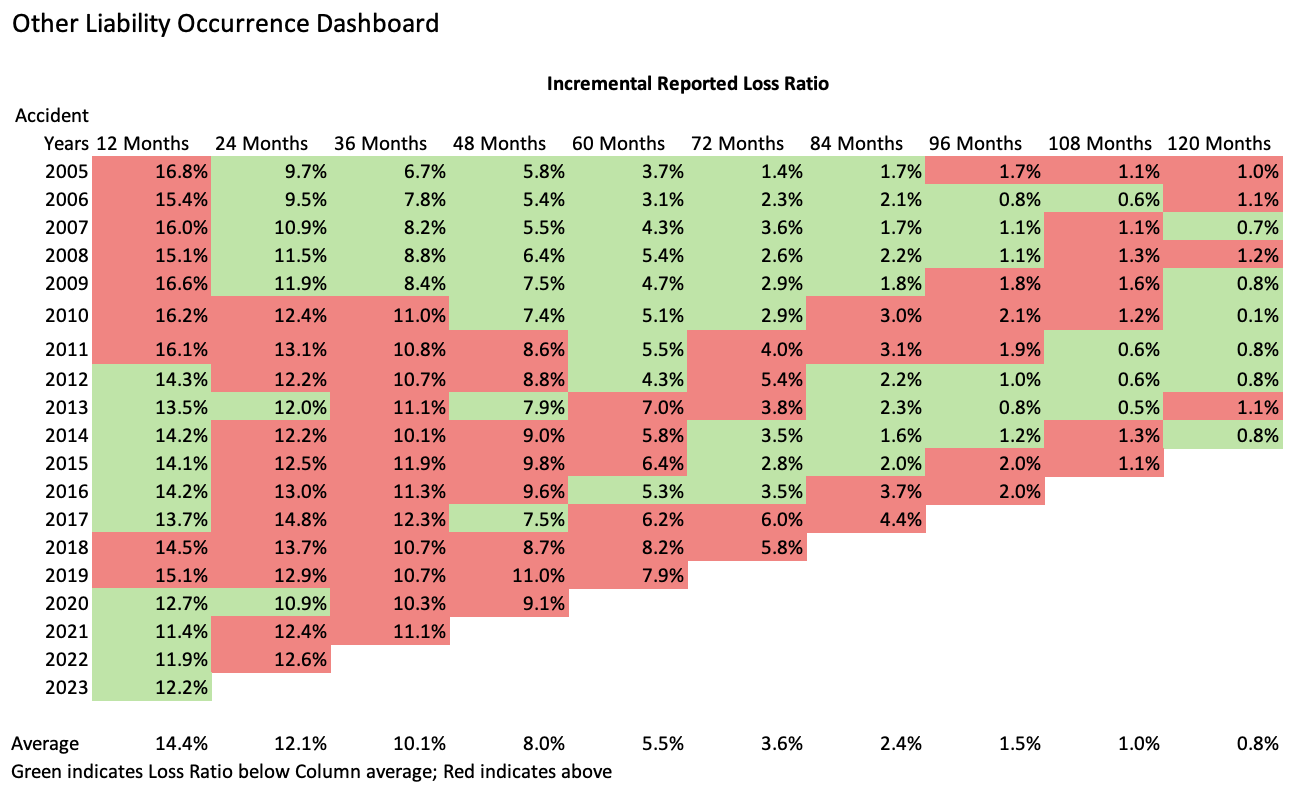
Let’s start with good news. We estimate the workers comp line still holds some $15.3 billion of reserve redundancies even though $6 billion of favorable development emerged in 2023. Impossible, you say! We get that and weren’t expecting this finding, but look at all the green or “cool” loss development in the triangle shown in our workers comp dashboard. (See the sidebar for a description of the two components in the dashboard for each line of insurance.)
Additional Thoughts on Workers Comp
We are concerned about pressures from medical inflation, though in fairness that looks to have recently crested in the 2.5-3.0 percent range—surely within the actuarial assumptions baked into loss reserves. We also believe that benefits from the decade-long trend of declining opioid prescriptions have largely run their course. (Related CM article, “Workers Compensation: Waning Benefits From Decreasing Opioid Rxs,” Sept. 28, 2023)
But the bottom line is that the industry appears to be providing for ample loss reserve development despite recent loss experience coming in well below initial expectations.
 Bad News—And Some Good: Other Liability Occurrence
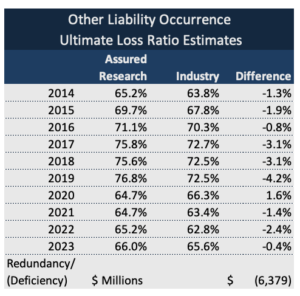
We estimate the other liability occurrence line harbors a reserve deficiency of about $6.4 billion. That’s the bad news. The good news is that we’re on board with the industry’s 65-66 percent ultimate loss ratio pick for AY 2023. More than perhaps any other line this exemplifies how we interpret the spirit of our exhortation to “keep calm and carry on.” We expect more adverse development from this line of insurance but also believe that the worst is over.
Not Good: Commercial Auto Liability
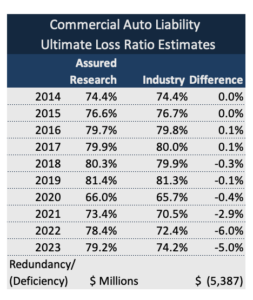
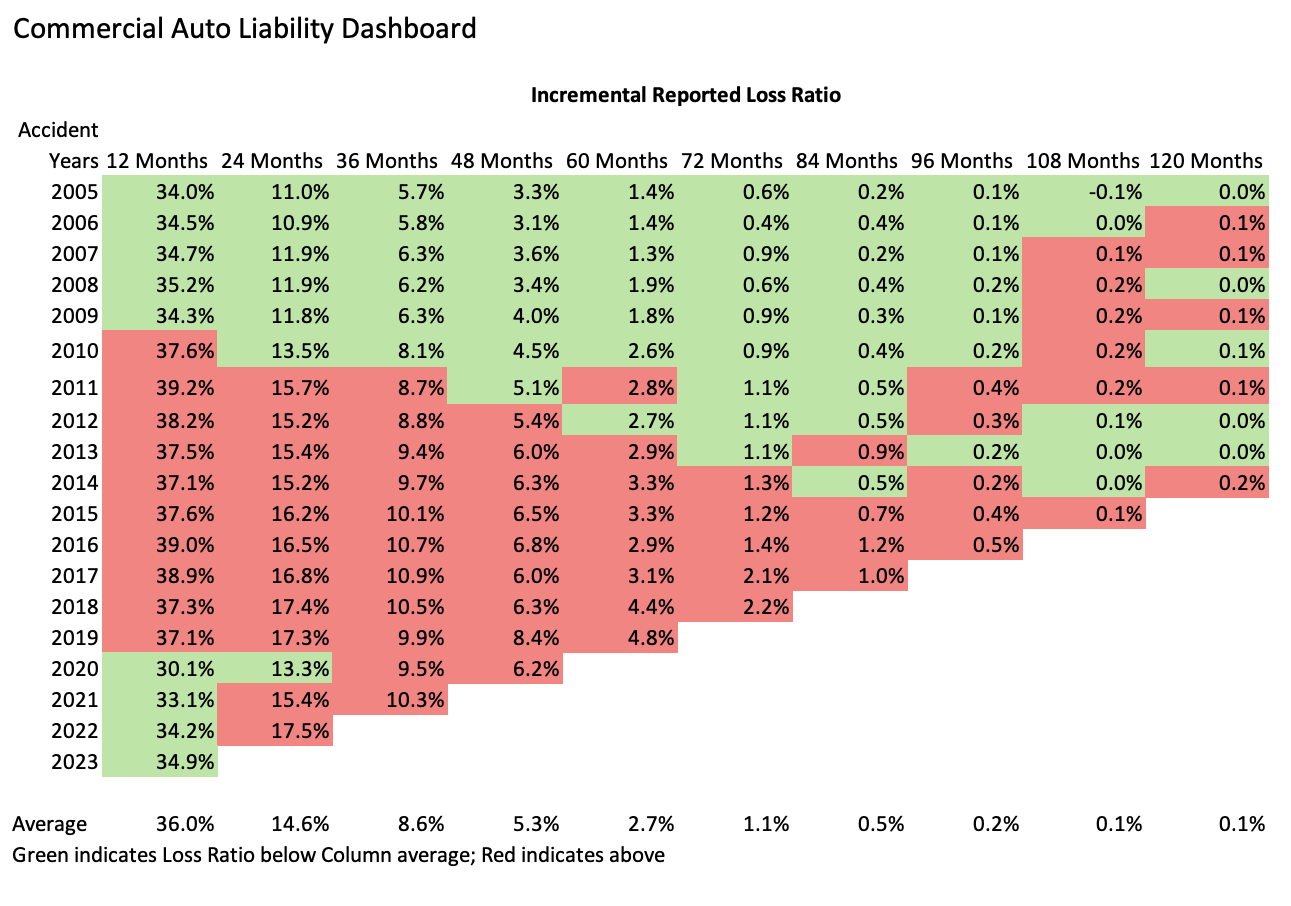
We estimate the commercial auto liability line harbors a reserve deficiency of about $5.4 billion. That’s the bad news. The worse news is that we estimate the industry’s ultimate loss ratios to be light by 5-6 loss ratio points for AYs 2022 and 2023. Not good!
The industry loss ratio picks for accident years 2022 and 2023 for commercial auto liability look a little light compared to Assured Research’s estimates.
Additional Thoughts on Commercial Auto
Although not shown, our analysis of industry claim counts reveals that commercial auto liability claims on AYs 2022-2023 are some 5 percent above pre-pandemic averages. That might be expected because the economy is humming and the transportation sector has been booming. But what’s interesting is that the claim counts for personal auto liability are still some 10 percent below pre-pandemic averages.
There is more on this in our Assured Report, but the bottom line is that the measures we reviewed all suggest that 1) commercial auto remains ground zero for social inflation; 2) the industry isn’t being sufficiently conservative in its loss picks for this line; and 3) we’d expect rate increases that are currently around 10 percent or so will be necessary for the immediately foreseeable future…and possibly increases higher than that.
Filling a Hole
One year ago, we wrote that the diagonals of the industry loss development triangles were manifesting the disruptions caused by economic and social inflation. We added that our confidence in the industry’s loss reserve adequacy had diminished.
This year, after the industry added nearly $8 billion of loss reserves to the two most problematic lines–other liability occurrence and commercial auto liability—we think much (but not all) of the financial hole the industry had dug from AYs 2016-2019 has now been filled. Meanwhile, the wellspring of reserve redundancies from workers compensation seems far from dry. But tempering that good news is what we perceive to be red-hot loss ratios in commercial auto liability and reserve deficiencies in general liability that still need to work through income statements.
Some might characterize the news in this report as representing a “mixed bag.” We think the areas of improvement outweigh areas of deterioration and, recognizing that there is always work to be done, prefer the message to keep calm and carry on.
***
What About Inflation?
A few technical notes
We’ll keep this short and invite interested readers to contact us for the full report with expanded details. We didn’t ignore inflation! In fact, we built an explicit provision into the reserves across most liability lines incorporating 4 points of trend for economic inflation (wages, medical and legal costs) and an additional 2.5 points for pressures for social inflation (not already baked into loss development factors or the case reserves along the diagonal).
Ours is an educated guess, though we did test our work by reworking our analysis using development factors from the last three years (two of which had rampant inflation) and blending in other traditional actuarial techniques.
The result: Our “explicit inflation provision” methodology added an extra $18.6 billion of indicated reserve need, which at least seemed directionally correct. Incorporating extra conservatism for the impact of economic and social inflation (beyond what’s baked into LDFs) seems sensible to us, though only time will tell if ours is of the right order of magnitude.
***
About the Dashboards
The triangles of red/green are an easy way to visualize loss ratio development patterns. Specifically, each row shows the incremental reported loss ratio (for an AY) by year of development. Averaging down a column will show the typical, incremental loss ratio development (across accident years) by stage of development. We’ve colored cells red where the loss ratio for a particular AY and stage of development is higher than (each column) average or green where it falls below. This process could be influenced by many trends, but in today’s environment the impacts of economic and social inflation on loss trends and earned rate changes on premiums will be chief among them.
We also show a comparison of our ULRs by accident year to the industry’s booked figures. We think this section is particularly important insofar as a reserve study provides valuable insights into the pricing adequacy of recently written and earned business.


 Lessons From 25 Years Leading Accident & Health at Crum & Forster
  Nearly 26.2M Workers Are Expected to Miss Work on Super Bowl Monday
  Earnings Wrap: With AI-First Mindset, ‘Sky Is the Limit’ at The Hartford
  Berkshire-owned Utility Urges Oregon Appeals Court to Limit Wildfire Damages


