


As insurers continue to evolve their enterprise risk management systems and controls, and regulators take a closer look, one aspect continues to be clear: Capital is king.
Executive Summary
A recent S&P survey reveals that insurers with the best S&P ERM scores are also the ones closest to meeting the deadline for submitting their ORSA self-assessments to regulators. The study also found that insurers overwhelmingly use capital—and to a lesser extent earnings—to benchmark risk tolerance, S&P’s Sridhar Manyem reports.A recent study by Standard & Poor’s Rating Services of insurer ERM practices across all sectors of the insurance industry reveals that insurers overwhelmingly use capital to benchmark risk tolerance, although their definitions of capital vary widely.
Regulatory Mandates
Regulators across the globe have started to require insurers to submit some form of Own Risk and Solvency Assessment, or ORSA. In principle, an insurer’s ORSA documents its risk management practices and ERM framework. According to the Insurance Core Principles established by the International Association of Insurance Supervisors, the prime purpose of the ORSA is to assess whether an insurer’s risk management and solvency position is currently adequate and is likely to remain so in the future.
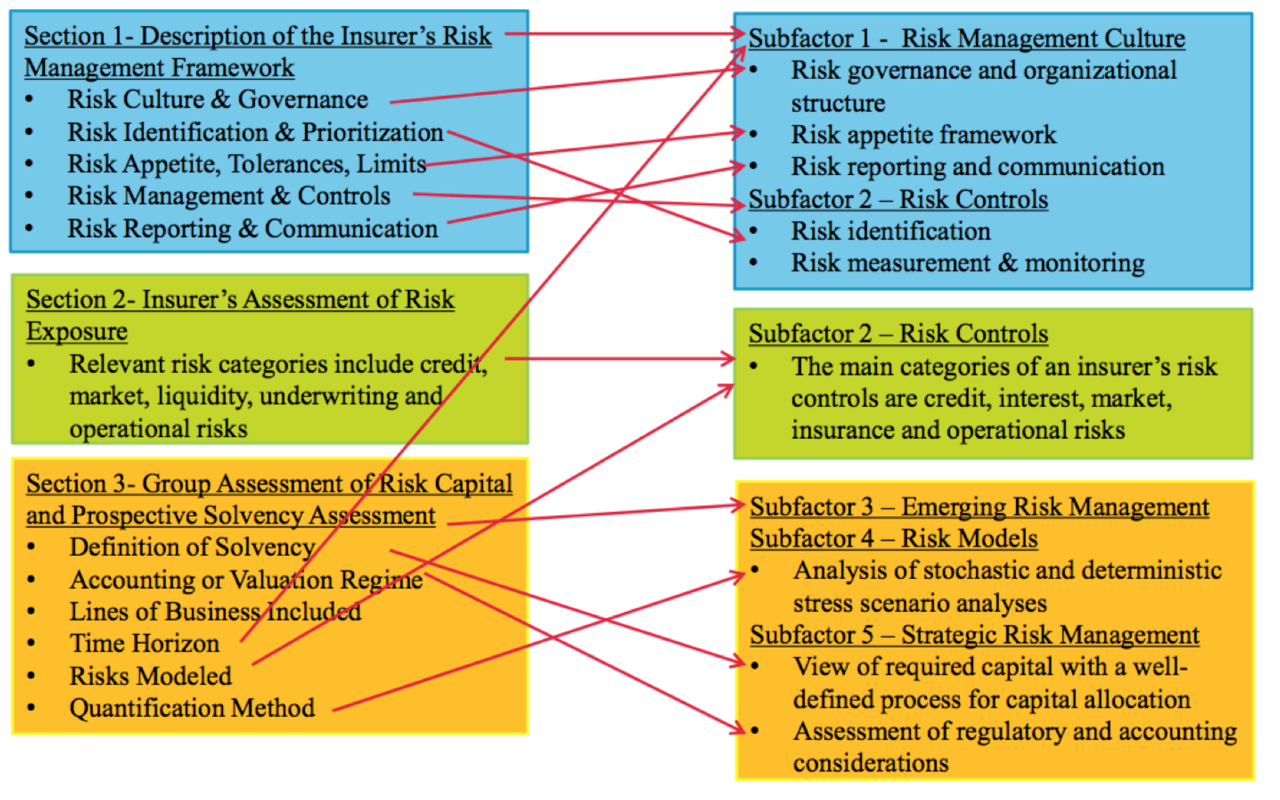
For example, the National Association of Insurance Commissioners (NAIC) has adopted a model law that requires insurers to submit their summary report documenting their ORSA framework starting in 2015. The ORSA required by NAIC has three broad sections:
- Description of an insurer’s risk management framework
- Insurer’s assessment of risk exposure
- Group risk capital and solvency assessment
S&P has been using enterprise risk management as a rating factor since 2005, and the components of our ERM framework—risk culture, risk controls, emerging risks management, risk models and strategic risk management—have remained the same. The NAIC’s framework maps well into one or multiple sections of the risk management framework as shown below:
 Good ERM will help almost any insurer, but ERM is not the sole determinant of higher ratings. Our ratings consider multiple factors such as capitalization, competitive position, and capital and earnings volatility. However, a strong ERM framework could lead to lower volatility as demonstrated by our research on the relationship between stock-price volatility and ERM scores. We have found that companies with better ERM scores exhibit lower volatility than companies with worse ERM scores. (See related article, “Assessing ERM: S&P Puts Risk Culture in Focus.”)
Survey Findings
S&P recently conducted it first survey of risk management practices at North American and Bermudian insurance companies. Our survey’s objective was to obtain information about insurance companies in a structured manner, and it was largely consistent with components we use to analyze an insurer’s ERM framework.
The survey results revealed that insurers with the best ERM scores are the ones closest to meeting the deadline for submitting their ORSA self-assessments to NAIC regulators. However, companies with lower ERM scores appear to be in need of some more progress before they can submit the ORSA report on time. Those in the lowest two categories of our ERM scoring—65 percent of those who responded to our risk management survey—said they had finished only half of their ORSA report and could therefore be at risk.
(Editor’s Note: S&P’s ERM scores are very strong, strong, adequate with strong risk controls, adequate and weak. Sixty-five percent of respondents fall in the adequate and weak categories. Across the S&P rating universe, the breakdown of the ERM scores is as follows: 2 percent are weak; 67 percent are adequate; 12 percent are adequate with strong risk controls; 17 percent are strong; 2 percent are very strong.)
Consistent with our expectations, the survey, which garnered 83 responses (35 percent from life insurers, 22 percent each from health and property/casualty companies, and the rest from reinsurance and multiline insurers), indicated that insurers overwhelmingly use capital (and to a lesser extent earnings) to benchmark risk tolerance. However, they vary widely in how they define capital. Insurers have at least six different ways of measuring capital, and not more than 27 percent of the insurers use the same one.
Some of the common definitions of capital include statutory surplus, generally accepted accounting principles (GAAP) equity and economic capital, and some insurers use a multiple of minimum required regulatory capital.
Insurers often adjust these definitions. For example, some companies may use an accounting form of capital but adjust for items such as unrealized gains and losses, pension plans, and reserve discounting. This is consistent with the survey, in which we found that no capital measure stands out in popularity. Earnings metrics exhibit similar dispersion.
The meaning and use of phrases such as risk tolerance, risk appetite and risk preference can also vary greatly among insurers.
We do not expect insurance companies to be similar in their risk-tolerance statements. We define risk tolerances as quantitative risk-appetite statements that guide the insurer in risk selection. These statements typically specify maximum acceptable losses. They help the insurer translate its qualitative risk preferences into action by constraining the insurer’s exposures to risks.
Risk tolerances are often probabilistic in nature, typically referring to the insurer’s solvency or earnings during a specified period at a chosen confidence level. Examples of risk tolerances include “maintaining capital adequacy consistent with target rating following a 30 percent equity market decline” or “constraining losses to within one quarter’s planned earnings following a 1-in-250-year event during the following year.”
Internal Models
In developing better tools to manage enterprise risk and meet regulatory scrutiny, more companies are moving toward some form of proprietary risk-measurement model. Almost 73 percent of the respondents had an internal economic or risk-capital model. Of the 61 companies with an internal model, 13 percent were health companies, 33 percent were P/C and reinsurers, 38 percent were life insurance companies, and 16 percent were multiline insurers.
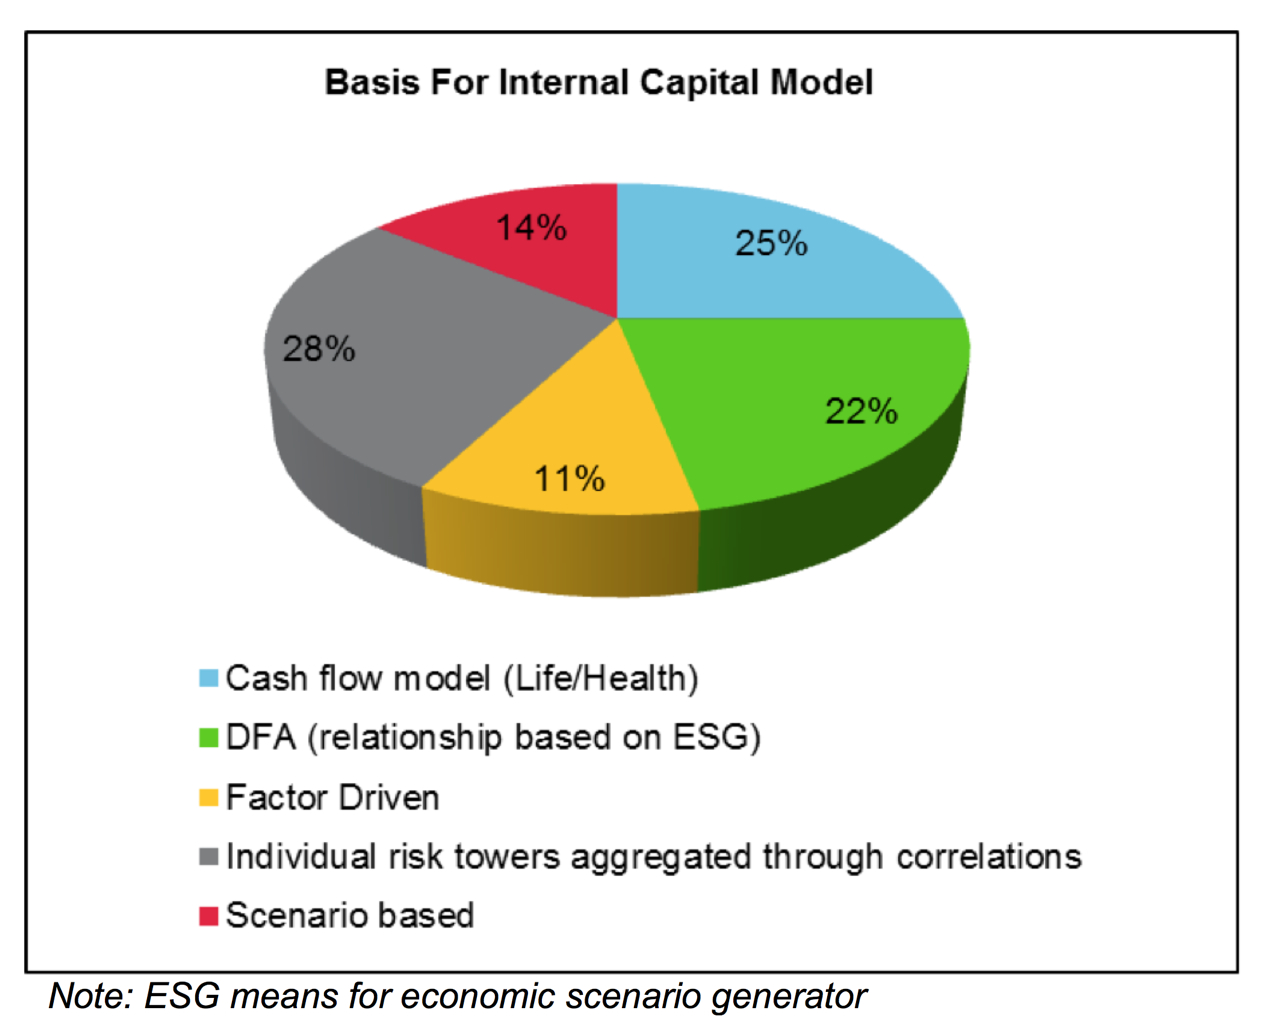
Internal models ranged from a customized rating agency or regulatory model to a sophisticated, dynamic financial analysis model that captures risks to assets and liabilities in a consistent manner. Insurers also commonly use individual risk models that are aggregated using correlation matrices.
Most insurers we surveyed (89 percent) already have internal targets that are at or above the regulatory capital requirements. This is because, although regulators are concerned about minimum capital required for solvency, insurers target capital on a “going concern” basis.
Life insurance companies tend to use more cash-flow testing models compared to others. Many insurers also use factor-based models where the factors can be derived based on their view of volatility.
 When insurers use stochastic models to measure risk tolerances, the choice of confidence level is a significant determinant of capital adequacy. For example, if a firm ties its capitalization to the 0.4 percent (1-in-250) capital-at-risk metric, it implies a target at that level of capital 99.6 percent of the time. But insurers aren’t using any widely accepted or industry benchmark confidence levels in risk-tolerance statements.
In our view, the absence of confidence levels as a metric in insurer’s risk tolerance may indicate that they are in the early stages of developing internal capital models and currently rely on statutory or rating agency models.
Capital and Strategy
Insurers optimize risk-adjusted returns through strategic risk management, deciding the amount of capital necessary for a product or business line and prioritizing their options based on economic risk/reward metrics consistent with risk appetite. They balance that against other concerns, including regulatory and accounting considerations.
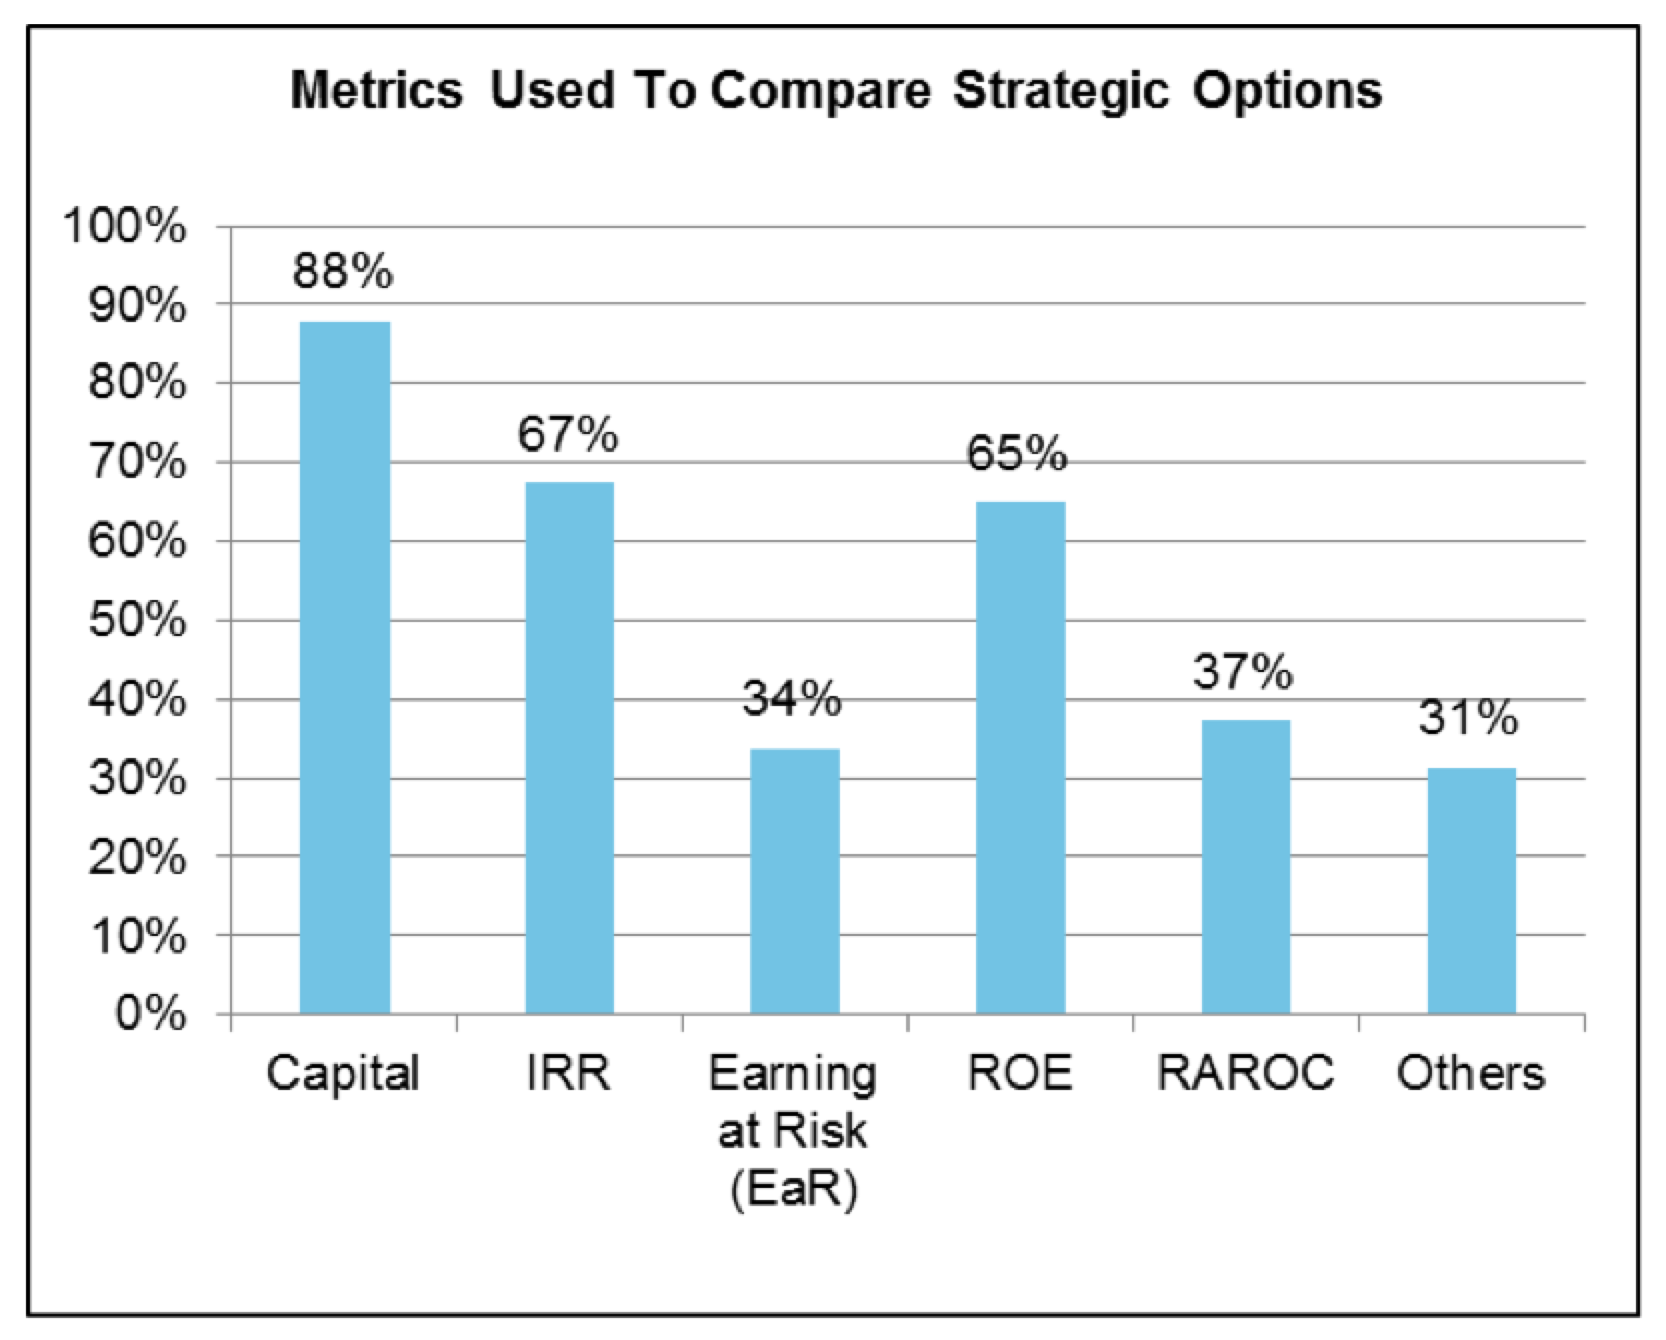
In comparing strategic options, 88 percent of surveyed companies use capital allocation to compare strategic options. For example, if an insurer needs to allocate capital between high-risk and low-risk exposures, the one with the higher risk would consume more capital (because the insurer needs more capital to protect against this risk since it is more likely to suffer losses) compared to a low-risk exposure. So, the amount of capital consumed forms one basis for comparing risks. The higher capital consumption, the more risk the insurer takes. The price that needs to be charged then is commensurately higher so that the insurer earns an appropriate return.
Companies use different types of capital to allocate to various risks, but regulatory capital, statutory surplus, GAAP equity and required economic capital were the most common. Although companies are increasingly using economic capital models, they recognize the reality that they can be constrained by regulatory and rating agency requirements. Therefore, they tend to use capital measures as the basis for allocating capital. Life and health companies tend to use regulatory capital in their strategic management decisions more than P/C companies.
 Insurers are more cognizant than ever of the dangers of inadequate ERM, and so are their regulators, whether in the U.S. or Europe. For many, it appears that capital—economic capital and internal capital models—will be one very important consideration in their ERM framework and decision-making.
A clear, comprehensive and well-thought-out ORSA report may be in everyone’s interest, especially now that the industry generally has the wind at its back. However, any insurance company that adopts a check-the-box attitude toward satisfying these regulatory requirements could easily come up short if the wind were to instead blow in its face.
Related videos:
 20,000 AI Users at Travelers Prep for Innovation 2.0; Claims Call Centers Cut
  Berkshire-owned Utility Urges Oregon Appeals Court to Limit Wildfire Damages
  Earnings Wrap-Up: AXIS Expanding Insurance Biz, Shrinking Re Book
  AIG, Chubb Can’t Use ‘Bump-Up’ Provision in D&O Policy to Avoid Coverage


