


Insurers often consider many factors when managing their rate levels, but it is common for underwriting results to play a role in subsequent ratemaking. Using the industry aggregate data reported to ISO, we wanted to find objective measures to help describe the relationship between loss experience and subsequent rate action.
We started with Commercial Auto liability data for this analysis. We looked at average rate changes by state on renewal policies from ISO MarketWatch® and aggregate loss ratios from the ISO DataCube™. The two datasets showed strong corresponding patterns.
The maps below show the rank of each state’s loss ratio for 2018-2022, and the average 2023 rate change in the state (indexed to the countrywide average).
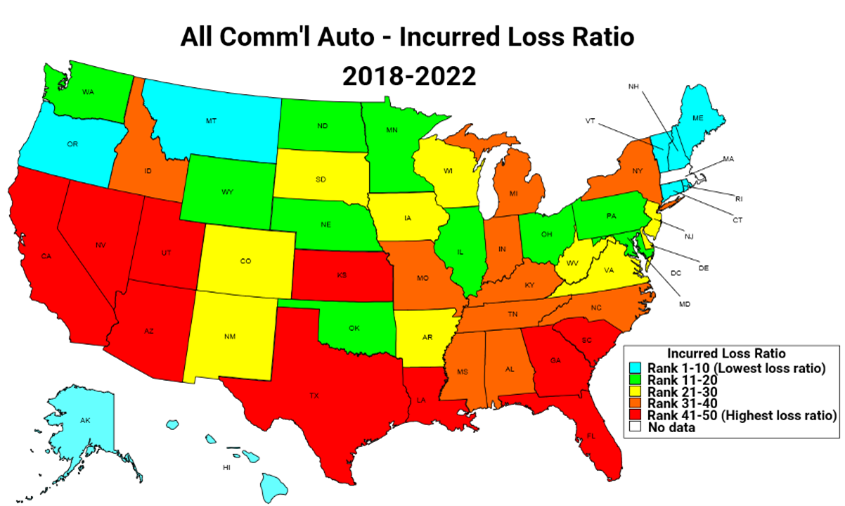
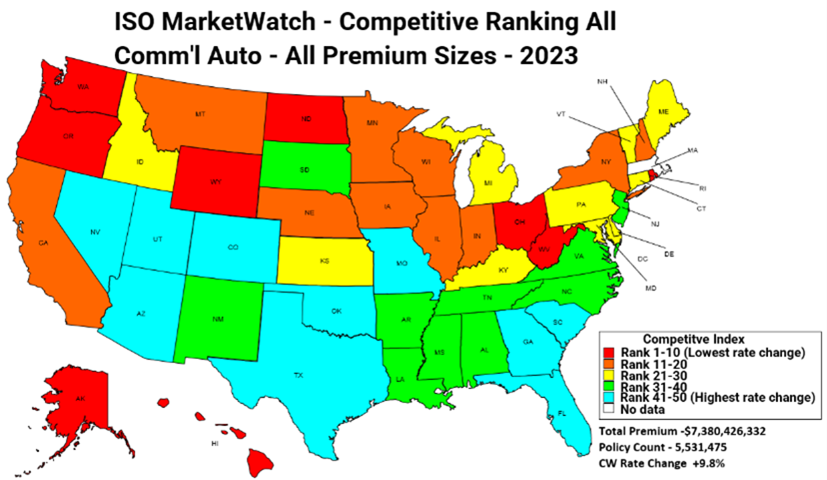
As shown in the maps, states with high loss ratios in 2018-2022 tended to have higher rate changes in 2023, and the inverse typically held as well. The 3 states with the highest loss ratios were also the 3 states with the largest rate increases. Of the 10 states with the highest loss ratios, 7 were in the top 10 for 2023 rate changes.
These mechanics can be summarized in the two-way table below, relating the count of states with each color from the maps above:
Commercial Auto Liability

The table can also be distilled into a single metric – the χ2 statistic, which measures the degree to which the loss ratios and rate changes correspond beyond what would be expected due to random chance (if they had no relationship).
For the table above the χ2 is 0.82. Establishing a benchmark can help us compare results as we begin to use this framework on other data for more lines or time periods.
If we extend the Commercial Auto analysis to include physical damage coverages as well, we get the following result:
Commercial Auto Liability and Physical Damage

The relationship strengthened with the inclusion of Physical Damage results, bringing the χ2 to 1.26.
The dynamics within each line of business likely impact the relationship. We plan to explore these further in future analyses. In the meantime, we ran the same analysis for 2018-2022 loss ratios and 2023 rate changes across Commercial Auto, Businessowners, General Liability, and Commercial Property. The results were as follows (now showing percentages in each cell):
Commercial Auto, BOP, GL, & Commercial Property

The χ2 is 0.45 for the multi-line table, which implies that the relationship for Commercial Auto appears stronger than average (among these lines of business). We also see that the relationship appears strongest at the extremes. One possible explanation is that these states can stand out even after credibility adjustments and then command rate attention.
This information on its own provides great insight into market dynamics, but this framework is versatile enough to help answer other questions such as:
- What timeframe of underwriting performance has the strongest relationship to subsequent rate changes?
- How do various cohorts of companies compare to the overall average?
- Are there relationships with other metrics such as loss development patterns and trend?
- How steady are these relationships over time (especially through different underwriting cycles)?
As always, we encourage readers to contact us with feedback or questions about this analysis (or about resources like MarketWatch and DataCube, which can assist with many other benchmarking and actuarial analyses).
 Beazley Agrees to Zurich’s Sweetened £8 Billion Takeover Bid
  Insurance Groundhogs Warming Up to Market Changes
  Earnings Wrap: With AI-First Mindset, ‘Sky Is the Limit’ at The Hartford
  Berkshire-owned Utility Urges Oregon Appeals Court to Limit Wildfire Damages